
lonely-star-049197
11 posts
Latest Posts by lonely-star-049197
hello! I love your blog. you helped me so much with writing. if you don't mind can you do writing notes on character study. I wanted for so long to do it but I'm lost. thanks for everything
Writing Notes: Character Study
Character Study - a deep dive into a character’s traits, personality, and development in literature, TV, and film.
GUIDE #1. The model below provides a guide for the analysis of the characters in order to identify the personality of each of them, their attitude and the network of relationships holding together the drama/story. The analysis will focus on:
the character’s physical appearance (description of body and face, clothes and accessories);
story of his/her life (identification of all biographical elements that define the character’s story and situate him or her in relation with the others);
point of view (interpretation of the character’s perspective in relation to the overall vision of world as proposed by the author);
personality (description of the character’s behavior defining his/her personality on stage as it relates to others: tone of the voice, gestures, movements, distance or proximity to other characters);
description of the mask (different ways in which each character places himself/herself in relation to others);
definition of the mask’s motivation and choice through which the character will achieve his/her goals.

GUIDE #2. Identify each character on the 4 basic levels of characterization from information you find in the text. The following is a list of suggestions for each category. This is by no means an all-inclusive list, but meant to be used as a guideline:
A. Physical/Biological. gender, age, size, coloration and general appearance
Age – be as specific as possible
Gender/Sex – not only male/female, but virile, macho, feminine, etc.
Health – from excellent to sickly, including how one’s health may or may not effect his/her appearance.
Particular physical characteristics that makes the character distinctive – big nose, hunchback, large breasts, etc.
Ethnic origin – race, coloring of skin and hair
Physical Stature/Figure – perfect, average, tall/short, thin/fat, malformed, hunched, slouchy, willowy, etc.
Physical Activity - dynamic, active, sedentary, listless, etc.
Face – handsome, good looks, common, homely, etc.
B. Social. economic status, profession or trade, religion, family relationships
Class Situation – aristocracy, upper, upper middle, middle, lower middle, lower, beggar etc.
Economic Situation – rich, independent, salaried, day labor, dependent (just because someone is a member of the aristocracy, doesn’t mean they have money)
Social Situation/Social Role - how is the character related to the other characters in the play? Family? Friends? Co-workers? The boss? The King? Etc. Is there a specific social event taking place, such as a wedding, where in the character has to take on a particular social role, such as father-of-the-bride?
Relationship to the World around him/her – How does the character fit into his/her social situation? Is the character popular? Does he/she have friends? Is he/she a loner? Etc. How does the character interact with the other characters - is the character: a leader, a helper, a follower, submissive, a slave?
Occupation – list the character’s specific job or trade
Group Affiliation – Does the character belong to or identify with a specific group or team? (example – a minority group, a club, a sports team, a political group, etc)
Is there a specific social event taking place, such as a protest rally, where in the character identifies with a particular group, such as feminists?
Political affiliation – Republican, Democrat, etc.
Religious affiliation – Christian, Jewish, Muslim, etc.
C. Psychological/Emotional Reveals habitual responses, desires, motivations, like and dislikes – the inner workings of the mind. Reveals how the characters think (psychological) and what they feel (emotional). This is considered the most essential level of characterization. Keep in mind that a person’s thoughts and feelings can often be determined as a further extension of his/her physical and social characteristics. For example – under social, you can determine a character’s religious affiliation. Under psychological/emotional, you can determine what that person thinks or feels about his/her religion.
Psychological State – what does the character think about his/herself and the world around them? Is the character: open-minded objective, subjective, unselfish, selfish, paranoid?
Emotional State – what does the character feel about his/herself and the world around them? Does the character feel: accepted, rejected, oppressed, etc?
Emotional Depth - are the character’s relationships: life-long, lasting, moderate, passing, momentary?
Emotional Control – no temper, slow temper, even tempered, quick tempered, a loose cannon
Emotional Type – extrovert, ambivert, introvert...
Desires or goals – what does the character want?
Loves – what, or who, does the character value?
Weaknesses – what, if anything, is a potential psychological or emotional weakness, on the part of the character, that can interfere with the character obtaining his/her desire?
Prejudices – what, if anything, does the character feel prejudicial about?
Fixed Attitudes – Similar to a prejudice, but not with the negative connotation. For example, in your social analysis you’ve determined the character is Jewish. Now, determine how that character feels or thinks about Judaism – is the character: a zealot, a liberal, orthodox, conventional, a skeptic?
D. Moral/Ethical Reveals what the characters are willing to do (moral beliefs) to get what they want and what characters actually do (ethical behavior) when faced with making a difficult choice. Determine the characters’ moral beliefs and ethical behavior, and how those relate to the world of the play. Be very careful not to judge them based upon your own morals and ethics. For example, you may believe it is morally wrong for two people to live together unless they are married. However, in the world of this play/literature, no characters may hold this moral belief, and the playwright/writer may not be making a point about this moral belief, and therefore such actions are not to be seen as immoral or unethical within the context of the work.
Moral beliefs – an individual’s or society’s beliefs in what is right and wrong in terms of behavior.
Is the character able to determine right from wrong and to make decisions based upon that knowledge?
Determine the individual character’s morals, based on what his/her conscience suggests is right and wrong, rather than on what the law or society dictates.
Determine the morals of the world of the play in general: the principles of right and wrong judged by the standards of the average person or society at large, and how those principles govern standards of general and/or sexual behavior. Does the character hold beliefs in contradiction to those of their society?
Does the character evolve/change? For example, is there a moral belief the character holds at the beginning of the play that he no longer holds at the end of the play? In other words, does something happen for the character to change his mind and be convinced otherwise?
In the work itself, is there a “moral to the story”? Is the writer using the character as a positive or negative example in relation to this moral?
Ethical behavior – how an individual or society conducts themselves according to their morals.
How does a character’s moral beliefs affect his/her conduct? For example, is a character unable to act due to a moral/ethical dilemma?
How does a character’s goals affect his/her conduct? Is the character’s ethical behavior contrary to his/her moral beliefs? For example, a character believes it is morally wrong to commit murder, but to obtain his goal, his is willing to behave unethically and kill.
Does the character believe that he is acting ethically, yet is the writer holding him up as an example of how one should not behave?
Does the character behave according to or contrary to any of the 4 basic levels, therefore giving a false perception of themselves to the other characters? For example, you may have determined that a character is seriously ill, yet the character behaves as if he were in perfect health. Or a character may masquerade as someone he is not. What morals and/or goals are affecting this behavior?
E. Mental/Intellectual A 5th area you can consider. Reveals how intelligent and creative a character may be.
IQ – brilliant, good mind, average, dull...
Education – scholar, college, self-made, schooled...
Mental type – philosophic, scientific, mechanical, artistic, social, scientific...
Dexterity – dexterous, skilled, handy, clumsy, uncoordinated...
Creativity – genius, talented, original, unoriginal...
Interests, skills, accomplishments
QUESTIONS
Who is the Protagonist? Who is the Antagonist?
Which characters are of Primary Focus?
Which characters are of Secondary Focus?
Which characters qualify as ‘set dressing’?
Are any of the characters Symbols or Metaphors?
Are any of the characters Formalized Conventions?
CHARACTER ANALYSIS. A character analysis is a close examination and evaluation of one character from a work of fiction such as a novel, short story, or play.
The only direct description of most characters in fiction is of their physical appearance and/or their professions.
Their identities and traits are established through their interactions with other characters as well as their opinions, reactions, and moods.
For instance, while introducing Katniss (from The Hunger Games), the author did not bluntly state that she is courageous. Rather, this was demonstrated through several scenes in the book, such as when she volunteered to take her sister’s place at the Reaping.
In a character analysis, the writer’s job is to pick up on such hints and subtle clues in the story to reveal a clear image of the subject character. The writer can also evaluate the character, critiquing their development and the role they played in the plot.
Developing a Character Analysis. In order to write a character analysis, the first task is to choose the subject, if not already determined in the assignment question. It is easier to pick if the writer is already familiar with the text in which the character exists. Recognizing the types of characters also helps during the selection.
Once the subject character has been decided upon, the text ought to be critically read, with special attention being paid to the character.
As mentioned earlier, much of their personality and qualities are hinted at and indicated indirectly through their actions and thoughts, and not openly stated.
Thus, the re-reading should be done with the aim of picking up on these clues.
Oftentimes, the character’s backstory is also not included in the text but can be discerned from their behavior and characteristics. It, too, should be pieced together during the analysis, as it has a bearing on the character’s actions and lets readers better understand their motivations.
A record of the character’s involvement in each element of the plot, how this involvement affected other characters, and the eventual direction and outcome of the story should also be kept. Their own personal changes/growth/development should also be tracked.
Outline of a Character Analysis Essay
Introduction: The text and the character are briefly introduced. The thesis statement informs readers of the thrust and goal of the essay. It includes a claim about or evaluation of the character that will be borne out by the rest of the essay.
Body: The character is delved into in greater detail here. The analysis is laid out where their traits, appearance, backstory, and role are examined in detail. The character’s growth – or lack of it – are highlighted here as well. An outline drawn up during the prewriting process helps in organizing this section in a coherent manner that holds up the claims in the thesis statement.
Conclusion: The essay is concluded with a final assessment of the character that confirms the validity of the thesis.
Sources: 1 2 3 4 5 ⚜ More: References ⚜ Writing Resources PDFs
Hi, thanks for telling me. Glad to hear this! Here are some tips and guides I found for you. There are numerous guidelines available online, so choose which one (or combine elements from such guides) you want to use. You can find more details in the sources linked above. Hope this helps.
Can LEO Satellites close the Gigabit Gap of Europe's Unconnectables?

Is LEO satellite broadband a cost-effective and capable option for rural areas of Europe? Given that most seem to agree that LEO satellites will not replace mobile broadband networks, it seems only natural to ask whether LEO satellites might help the EU Commission's Digital Decade Policy Programme (DDPP) 2030 goal of having all EU households (HH) covered by gigabit connections delivered by so-called very high-capacity networks, including gigabit capable fiber-optic and 5G networks, by 2030 (i.e., only focusing on the digital infrastructure pillar of the DDPP).
As of 2023, more than €80 billion had been allocated in national broadband strategies and through EU funding instruments, including the Connecting Europe Facility and the Recovery and Resilience Facility. However, based on current deployment trajectories and cost structures, an additional €120 billion or more is expected to close the remaining connectivity gap from the approximately 15.5 million rural homes without a gigabit option in 2023. This brings the total investment requirement to over €200 billion. The shortfall is most acute in rural and hard-to-reach regions where network deployment is significantly more expensive. In these areas, connecting a single household with high-speed broadband infrastructure, especially via FTTP, can easily exceed €10,000 in public subsidy, given the long distances and low density of premises. It would be a very "cheap" alternative for Europe if a non-EU-based (i.e., USA) satellite constellation could close the gigabit coverage gap even by a small margin. However, given some of the current geopolitical factors, 200 billion euros could enable Europe to establish its own large LEO satellite constellation if it can match (or outperform) the unitary economics of SpaceX, rather than its IRIS² satellite program.
In this article, my analysis focuses on direct-to-dish low Earth orbit (LEO) satellites with expected capabilities comparable to, or exceeding, those projected for SpaceX’s Starlink V3, which is anticipated to deliver up to 1 Terabit per second of total downlink capacity. For such satellites to represent a credible alternative to terrestrial gigabit connectivity, several thousand would need to be in operation. This would allow overlapping coverage areas, increasing effective throughput to household outdoor dishes across sparsely populated regions. Reaching such a scale may take years, even under optimistic deployment scenarios, highlighting the importance of aligning policy timelines with technological maturity.
GIGABITS IN THE EU - WHERE ARE WE, AND WHERE DO WE THINK WE WILL GO?
In 2023, Fibre-to-the-Premises (FTTP) rural HH coverage was ca. 52%. For the EU28, this means that approximately 16 million rural homes lack fiber coverage.
By 2030, projected FTTP deployment in the EU28 will result in household coverage reaching almost 85% of all rural homes (under so-called BaU conditions), leaving approximately 5.5 million households without it.
Due to inferior economics, it is estimated that approximately 10% to 15% of European households are "unconnectable" by FTTP (although not necessarily by FWA or broadband mobile in general).
EC estimated (in 2023) that over 80 billion euros in subsidies have been allocated in national budgets, with an additional 120 billion euros required to close the gigabit ambition gap by 2030 (e.g., over 10,000 euros per remaining rural household in 2023).
So, there is a considerable number of so-called "unconnectable" households within the European Union (i.e., EU28). These are, for example, isolated dwellings away from inhabited areas (e.g., settlements, villages, towns, and cities). They often lack the most basic fixed communications infrastructure, although some may have old copper lines or only relatively poor mobile coverage.
The figure below illustrates the actual state of FTTP deployment in rural households in 2023 (orange bars) as well as a Rural deployment scenario that extends FTTP deployment to 2030, using the maximum of the previous year's deployment level and the average of the last three years' deployment levels. Any level above 80% grows by 1% pa (arbitrarily chosen). The data source for the above is "Digital Decade 2024: Broadband Coverage in Europe 2023" by the European Commission. The FTTP pace has been chosen individually for suburban and rural areas to match the expectations expressed in the reports for 2030.

ARE LEO DIRECT-TO-DISH (D2D) SATELLITES A CREDIBLE ALTERNATIVE FOR THE "UNCONNECTABLES"?
For Europe, a non-EU-based (i.e., US-based) satellite constellation could be a very cost-effective alternative to closing the gigabit coverage gap.
Megabit connectivity (e.g., up to 100+ Mbps) is already available today with SpaceX Starlink LEO satellites in rural areas with poor broadband alternatives.
The SpaceX Starlink V2 satellite can provide approximately 100 Gbps (V1.5 ~ 20+ Gbps), and its V3 is expected to deliver 1,000 Gbps within the satellite's coverage area, with a maximum coverage radius of over 500 km.
The V3 may have 320 beams (or more), each providing approximately ~3 Gbps (i.e., 320 x 3 Gbps is ca. 1 Tbps). With a frequency re-use factor of 40, 25 Gbps can be supplied within a unique coverage area. With "adjacent" satellites (off-Nadir), the capacity within a unique coverage area can be enhanced by additional beams that overlap the primary satellite (Nadir).
With an estimated EU28 "unconnectable" household density of approximately 1.5 per square kilometer, the LEO satellite constellation would cover more than 20,000 households, each with a capacity of 20 Gbps over an area of 15,000 square kilometers.
At a peak-hour user concurrency of 15% and a per-user demand of 1 Gbps, the backhaul demand would reach 3 terabits per second (Tbps). This means we have an oversubscription ratio of approximately 3:1, which must be met by a single 1 Tbps satellite, or could be served by three overlapping satellites.
This assumes a 100% take-up rate of the unconnectable HHs and that each would select a 1 Gbps service (assuming such would be available). In rural areas, the take-up rate may not be significantly higher than 60%, and not all households will require a 1 Gbps service.
This also assumes that there are no alternatives to LEO satellite direct-to-dish service, which seems unlikely for at least some of the 20,000 "unconnectable" households. Given the typical 5G coverage conditions associated with the frequency spectrum license conditions, one might hope for some decent 5G coverage; alas, it is unlikely to be gigabit in deep rural and isolated areas.
For example, consider the Starlink LEO satellite V1.5, which has a total capacity of approximately 25 Gbps, comprising 32 beams that deliver 800 Mbps per beam, including dual polarization, to a ground-based user dish. It can provide a maximum of 6.4 Gbps over a minimum area of ca. 6,000 km² at nadir with an Earth-based dish directly beneath the satellite. If a household demands 100 Mbps at peak, only 60 households can be online at full load concurrently per area. With 10% concurrency, this implies that we can have a total of 600 households per area (i.e., 0.1 households per km²). For a V1.5 satellite, we can support four regions (i.e., frequency reuse groups), each with a maximum of 6.4 Gbps. Thus, the satellite can support a total of 2,400 households (i.e., 4 x 600) with a peak demand of 100 Mbps and a concurrency rate of 10%. As other satellites (off-nadir) can support the primary satellite, it means that some areas' demand may be supported by two to three different satellites, providing a multiplier effect that can increase the capacity offered.
By 2030, the EU28 rural areas are expected to achieve nearly 85% FTTP coverage under business-as-usual deployment scenarios. This would leave approximately 5.5 million households, referred to as “unconnectables,” without direct access to high-speed fiber. These households are typically isolated, located in sparsely populated or geographically challenging regions, where the economics of fiber deployment become prohibitively uneconomical. Although there may be alternative broadband options, such as FWA, 5G mobile coverage, or copper, it is unlikely that such "unconnectable" homes would sustainably have a gigabit connection.
This may be where LEO satellite constellations enter the picture as a possible alternative to deploying fiber optic cables in uneconomical areas, such as those that are unconnectable. The anticipated capabilities of Starlink’s third-generation (V3) satellites, offering approximately 1 Tbps of total downlink capacity with advanced beamforming and frequency reuse, already make them a viable candidate for servicing low-density rural areas, assuming reasonable traffic models similar to those of an Internet Service Provider (ISP). With modest overlapping coverage from two or three such satellites, these systems could deliver gigabit-class service to tens of thousands of dispersed households without (much) oversubscription, even assuming relatively high concurrency and usage.
Considering this, there seems little doubt that an LEO constellation, just slightly more capable than SpaceX's Starlink V3 satellite, appears to be able to fully support the broadband needs of the remaining unconnected European households expected by 2030. This also aligns well with the technical and economic strengths of LEO satellites: they are ideally suited for delivering high-capacity service to regions where population density is too low to justify terrestrial infrastructure, yet digital inclusion remains equally essential.
LOW-EARTH ORBIT SATELLITES DIRECT-TO-DISRUPTION.
I have in my blog "Will LEO Satellite Direct-to-Cell Networks make Terrestrial Networks Obsolete?" I provided some straightforward reasons why the LEO satellite with direct to an unmodified smartphone capabilities (e.g., Lynk Global, AST Spacemobile) would not make existing cellular network obsolete and would be of most value in remote or very rural areas where no cellular coverage would be present (as explained very nicely by Lynk Global) offering a connection alternative to satellite phones such as Iridium, and thus being complementary existing terrestrial cellular networks. Thus, despite the hype, we should not expect a direct disruption to regular terrestrial cellular networks from LEO satellite D2C providers.
Of course, the question could also be asked whether LEO satellites directed to an outdoor (terrestrial) dish could threaten existing fiber optic networks, the business case, and the value proposition. After all, the SpaceX Starlink V3 satellite, not yet operational, is expected to support 1 Terabit per second (Tbps) over a coverage area of several thousand kilometers in diameter. It is no doubt an amazing technological achievement for SpaceX to have achieved a 10x leap in throughput from its present generation V2 (~100 Gbps).
However, while a V3-like satellite may offer an (impressive) total capacity of 1 Tbps, this capacity is not uniformly available across its entire footprint. It is distributed across multiple beams, potentially 256 or more, each with a bandwidth of approximately 4 Gbps (i.e., 1 Tbps / 256 beams). With a frequency reuse factor of, for example, 5, the effective usable capacity per unique coverage area becomes a fraction of the satellite’s total throughput. This means that within any given beam footprint, the satellite can only support a limited number of concurrent users at high bandwidth levels.
As a result, such a satellite cannot support more than roughly a thousand households with concurrent 1 Gbps demand in any single area (or, alternatively, about 10,000 households with 100 Mbps concurrent demand). This level of support would be equivalent to a small FTTP (sub)network serving no more than 20,000 households at a 50% uptake rate (i.e., 10,000 connected homes) and assuming a concurrency of 10%. A deployment of this scale would typically be confined to a localized, dense urban or peri-urban area, rather than the vast rural regions that LEO systems are expected to serve.
In contrast, a single Starlink V3-like satellite would cover a vast region, capable of supporting similar or greater numbers of users, including those in remote, low-density areas that FTTP cannot economically reach. The satellite solution described here is thus not designed to densify urban broadband, but rather to reach rural, remote, and low-density areas where laying fiber is logistically or economically impractical. Therefore, such satellites and conventional large-scale fiber networks are not in direct competition, as they cannot match their density, scale, or cost-efficiency in high-demand areas. Instead, it complements fiber infrastructure by providing connectivity and reinforces the case for hybrid infrastructure strategies, in which fiber serves the dense core, and LEO satellites extend the digital frontier.
However, terrestrial providers must closely monitor their FTTP deployment economics and refrain from extending too far into deep rural areas beyond a certain household density, which is likely to increase over time as satellite capabilities improve. The premise of this blog is that capable LEO satellites by 2030 could serve unconnected households that are unlikely to have any commercial viability for terrestrial fiber and have no other gigabit coverage option. Within the EU28, this represents approximately 5.5 million remote households. A Starlink V3-like 1 Tbps satellite could provide a gigabit service (occasionally) to those households and certainly hundreds of megabits per second per isolated household. Moreover, it is likely that over time, more capable satellites will be launched, with SpaceX being the most likely candidate for such an endeavor if it maintains its current pace of innovation. Such satellites will likely become increasingly interesting for household densities above 2 households per square kilometer. However, suppose an FTTP network has already been deployed. In that case, it seems unlikely that the satellite broadband service would render the terrestrial infrastructure obsolete, as long as it is priced competitively in comparison to the satellite broadband network.
LEO satellite direct-to-dish (D2D) based broadband networks may be a credible and economical alternative to deploying fiber in low-density rural households. The density boundary of viable substitution for a fiber connection with a gigabit satellite D2D connection may shift inward (from deep rural, low-density household areas). This reinforces the case for hybrid infrastructure strategies, in which fiber serves the denser regions and LEO satellites extend the digital frontier to remote and rural areas.
THE USUAL SUSPECT - THE PUN INTENDED.
By 2030, SpaceX's Starlink will operate one of the world's most extensive low Earth orbit (LEO) satellite constellations. As of early 2025, the company has launched more than 6,000 satellites into orbit; however, most of these, including V1, V1.5, and V2, are expected to cease operation by 2030. Industry estimates suggest that Starlink could have between 15,000 and 20,000 operational satellites by the end of the decade, which I anticipate to be mainly V3 and possibly a share of V4. This projection depends largely on successfully scaling SpaceX’s Starship launch vehicle, which is designed to deploy up to 60 or more next-generation V3 satellites per mission with the current cadence. However, it is essential to note that while SpaceX has filed applications with the International Telecommunication Union (ITU) and obtained FCC authorization for up to 12,000 satellites, the frequently cited figure of 42,000 satellites includes additional satellites that are currently proposed but not yet fully authorized.

The figure above, based on an idea of John Strand of Strand Consult, provides an illustrative comparison of the rapid innovation and manufacturing cycles of SpaceX LEO satellites versus the slower progression of traditional satellite development and spectrum policy processes, highlighting the growing gap between technological advancement and regulatory adaptation. This is one of the biggest challenges that regulatory institutions and policy regimes face today.
Amazon’s Project Kuiper has a much smaller planned constellation. The Federal Communications Commission (FCC) has authorized Amazon to deploy 3,236 satellites under its initial phase, with a deadline requiring that at least 1,600 be launched and operational by July 2026. Amazon began launching test satellites in 2024 and aims to roll out its service in late 2025 or early 2026. On April 28, 2025, Amazon launched its first 27 operational satellites for Project Kuiper aboard a United Launch Alliance Atlas (ULA) V rocket from Cape Canaveral, Florida. This marks the beginning of Amazon's deployment of its planned 3,236-satellite constellation aimed at providing global broadband internet coverage. Though Amazon has hinted at potential expansion beyond its authorized count, any Phase 2 remains speculative and unapproved. If such an expansion were pursued and granted, the constellation could eventually grow to 6,000 satellites, although no formal filings have yet been made to support the higher amount.
China is rapidly advancing its low Earth orbit (LEO) satellite capabilities, positioning itself as a formidable competitor to SpaceX's Starlink by 2030. Two major Chinese LEO satellite programs are at the forefront of this effort: the Guowang (13,000) and Qianfan (15,000) constellations. So, by 2030, it is reasonable to expect that China will field a national LEO satellite broadband system with thousands of operational satellites, focused not just on domestic coverage but also on extending strategic connectivity to Belt and Road Initiative (BRI) countries, as well as regions in Africa, Asia, and South America. Unlike SpaceX’s commercially driven approach, China’s system is likely to be closely integrated with state objectives, combining broadband access with surveillance, positioning, and secure communication functionality. While it remains unclear whether China will match SpaceX’s pace of deployment or technological performance by 2030, its LEO ambitions are unequivocally driven by geopolitical considerations. They will likely shape European spectrum policy and infrastructure resilience planning in the years ahead. Guowang and Qianfan are emblematic of China's dual-use strategy, which involves developing technologies for both civilian and military applications. This approach is part of China's broader Military-Civil Fusion policy, which seeks to integrate civilian technological advancements into military capabilities. The dual-use nature of these satellite constellations raises concerns about their potential military applications, including surveillance and communication support for the People's Liberation Army.
AN ILLUSTRATION OF COVERAGE - UNITED KINGDOM.
It takes approximately 172 Starlink beams to cover the United Kingdom, with 8 to 10 satellites overhead simultaneously. To have a persistent UK coverage in the order of 150 satellite constellations across appropriate orbits. Starlink’s 53° inclination orbital shell is optimized for mid-latitude regions, providing frequent satellite passes and dense, overlapping beam coverage over areas like southern England and central Europe. This results in higher throughput and more consistent connectivity with fewer satellites. In contrast, regions north of 53°N, such as northern England and Scotland, lie outside this optimal zone and depend on higher-inclination shells (70° and 97.6°), which have fewer satellites and wider, less efficient beams. As a result, coverage in these Northern areas is less dense, with lower signal quality and increased latency.
For this blog, I developed a Python script, with fewer than 600 lines of code (It's a physicist's code, so unlikely to be super efficient), to simulate and analyze Starlink's satellite coverage and throughput over the United Kingdom using real orbital data. By integrating satellite propagation, beam modeling, and geographic visualization, it enables a detailed assessment of regional performance from current Starlink deployments across multiple orbital shells. Its primary purpose is to assess how the currently deployed Starlink constellation performs over UK territory by modeling where satellites pass, how their beams are steered, and how often any given area receives coverage. The simulation draws live TLE (Two-Line Element) data from Celestrak, a well-established source for satellite orbital elements. Using the Skyfield library, the code propagates the positions of active Starlink satellites over a 72-hour period, sampling every 5 minutes to track their subpoints across the United Kingdom. There is no limitation on the duration or sampling time. Choosing a more extended simulation period, such as 72 hours, provides a more statistically robust and temporally representative view of satellite coverage by averaging out orbital phasing artifacts and short-term gaps. It ensures that all satellites complete multiple orbits, allowing for more uniform sampling of ground tracks and beam coverage, especially from shells with lower satellite densities, such as the 70° and 97.6° inclinations. This results in smoother, more realistic estimates of average signal density and throughput across the entire region.
Each satellite is classified into one of three orbital shells based on inclination angle: 53°, 70°, and 97.6°. These shells are simulated separately and collectively to understand their individual and combined contributions to UK coverage. The 53° shell dominates service in the southern part of the UK, characterized by its tight orbital band and high satellite density (see the Table below). The 70° shell supplements coverage in northern regions, while the 97.6° polar shell offers sparse but critical high-latitude support, particularly in Scotland and surrounding waters. The simulation assumes several (critical) parameters for each satellite type, including the number of beams per satellite, the average beam radius, and the estimated throughput per beam. These assumptions reflect engineering estimates and publicly available Starlink performance information, but are deliberately simplified to produce regional-level coverage and throughput estimates, rather than user-specific predictions. The simulation does not account for actual user terminal distribution, congestion, or inter-satellite link (ISL) performance, focusing instead on geographic signal and capacity potential.

These parameters were used to infer beam footprints and assign realistic signal density and throughput values across the UK landmass. The satellite type was inferred from its shell (e.g., most 53° shell satellites are currently V1.5), and beam properties were adjusted accordingly.

The table above presents the core beam modeling parameters and satellite-specific assumptions used in the Starlink simulation over the United Kingdom. It includes general values for beam steering behavior, such as Gaussian spread, steering limits, city-targeting probabilities, and beam spacing constraints, as well as performance characteristics tied to specific satellite generations to the extent it is known (e.g., Starlink V1.5, V2 Mini, and V2 Full). These assumptions govern the placement of beams on the Earth’s surface and the capacity each beam can deliver. For instance, the City Exclusion Radius of 0.25 degrees corresponds to a ~25 km buffer around urban centers, where beam placement is probabilistically discouraged. Similarly, the beam radius and throughput per beam values align with known design specifications submitted by SpaceX to the U.S. Federal Communications Commission (FCC), particularly for Starlink’s V1.5 and V2 satellites. The table above also defines overlap rules, specifying the maximum number of beams that can overlap in a region and the maximum number of satellites that can contribute beams to a given point. This helps ensure that simulations reflect realistic network constraints rather than theoretical maxima.
Overall, the developed code offers a geographically and physically grounded simulation of how the existing Starlink network performs over the UK. It helps explain observed disparities in coverage and throughput by visualizing the contribution of each shell and satellite generation. This modeling approach enables planners and researchers to quantify satellite coverage performance at national and regional scales, providing insight into both current service levels and facilitating future constellation evolution, which is not discussed here.

This image above presents the Starlink Average Coverage Density over the United Kingdom, a result from a 72-hour simulation using real satellite orbital data from Celestrak. It illustrates the mean signal exposure across the UK, where color intensity reflects the frequency and density of satellite beam illumination at each location.
At the center of the image, a bright yellow core indicating the highest signal strength is clearly visible over the English Midlands, covering cities such as Birmingham, Leicester, and Bristol. The signal strength gradually declines outward in a concentric pattern—from orange to purple—as one moves northward into Scotland, west toward Northern Ireland, or eastward along the English coast. While southern cities, such as London, Southampton, and Plymouth, fall within high-coverage zones, northern cities, including Glasgow and Edinburgh, lie in significantly weaker regions. The decline in signal intensity is especially apparent beyond the 56°N latitude. This pattern is entirely consistent with what we know about the structure of the Starlink satellite constellation. The dominant contributor to coverage in this region is the 53° inclination shell, which contains 3,848 satellites spread across 36 orbital planes. This shell is designed to provide dense, continuous coverage to heavily populated mid-latitude regions, such as the southern United Kingdom, continental Europe, and the continental United States. However, its orbital geometry restricts it to a latitudinal range that ends near 53 to 54°N. As a result, southern and central England benefit from frequent satellite passes and tightly packed overlapping beams, while the northern parts of the UK do not. Particularly, Scotland lies at or beyond the shell’s effective coverage boundary.
The simulation may indicate how Starlink’s design prioritizes population density and market reach. Northern England receives only partial benefit, while Scotland and Northern Ireland fall almost entirely outside the core coverage of the 53° shell. Although some coverage in these areas is provided by higher inclination shells (specifically, the 70° shell with 420 satellites and the 97.6° polar shell with 227 satellites), these are sparser in both the number of satellites and the orbital planes. Their beams may also be broader and less (thus) less focused, resulting in lower average signal strength in high-latitude regions.
So, why is the coverage not textbook nice hexagon cells with uniform coverage across the UK? The simple answer is that real-world satellite constellations don’t behave like the static, idealized diagrams of hexagonal beam tiling often used in textbooks or promotional materials. What you're seeing in the image is a time-averaged simulation of Starlink's actual coverage over the UK, reflecting the dynamic and complex nature of low Earth orbit (LEO) systems like Starlink’s. Unlike geostationary satellites, LEO satellites orbit the Earth roughly every 90 minutes and move rapidly across the sky. Each satellite only covers a specific area for a short period before passing out of view over the horizon. This movement causes beam coverage to constantly shift, meaning that any given spot on the ground is covered by different satellites at different times. While individual satellites may emit beams arranged in a roughly hexagonal pattern, these patterns move, rotate, and deform continuously as the satellite passes overhead. The beams also vary in shape and strength depending on their angle relative to the Earth’s surface, becoming elongated and weaker when projected off-nadir, i.e., when the satellite is not directly overhead. Another key reason lies in the structure of Starlink’s orbital configuration. Most of the UK’s coverage comes from satellites in the 53° inclination shell, which is optimized for mid-latitude regions. As a result, southern England receives significantly denser and more frequent coverage than Scotland or Northern Ireland, which are closer to or beyond the edge of this shell’s optimal zone. Satellites serving higher latitudes originate from less densely populated orbital shells at 70° and 97.6°, which result in fewer passes and wider, less efficient beams.
The above heatmap does not illustrate a snapshot of beam locations at a specific time, but rather an averaged representation of how often each part of the UK was covered over a simulation period. This type of averaging smooths out the moment-to-moment beam structure, revealing broader patterns of coverage density instead. That’s why we see a soft gradient from intense yellow in the Midlands, where overlapping beams pass more frequently, to deep purple in northern regions, where passes are less common and less centered.

The two charts below provide a visual confirmation of the spatial coverage dynamics behind the Starlink signal strength distribution over the United Kingdom. Both are based on a 72-hour simulation using real Starlink satellite data obtained from Celestrak, and they accurately reflect the operational beam footprints and orbital tracks of currently active satellites over the United Kingdom.

The first chart displays the beam footprints (i.e., the left side chart above) of Starlink satellites across the UK, color-coded by orbital shell: cyan for the 53° shell, green for the 70° shell, and magenta for the 97° polar shell. The concentration of cyan beam circles in southern and central England vividly demonstrates the dominance of the 53° shell in this region. These beams are tightly packed and frequent, explaining the high signal coverage in the earlier signal strength heatmap. In contrast, northern England and Scotland are primarily served by green and magenta beams, which are more sparse and cover larger areas — a clear indication of the lower beam density from the higher-inclination shells.
The second chart illustrates the satellite ground tracks (i.e., the right side chart above) over the same period and geographic area. Again, the saturation of cyan lines in the southern UK underscores the intensive pass frequency of satellites in the 53° inclined shell. As one moves north of approximately 53°N, these tracks vanish almost entirely, and only the green (70° shell) and magenta (97° shell) paths remain. These higher inclination tracks cross through Scotland and Northern Ireland, but with less spatial and temporal density, which supports the observed decline in average signal strength in those areas.
Together, these two charts provide spatial and orbital validation of the signal strength results. They confirm that the stronger signal levels seen in southern England stem directly from the concentrated beam targeting and denser satellite presence of the 53° shell. Meanwhile, the higher-latitude regions rely on less saturated shells, resulting in lower signal availability and throughput. This outcome is not theoretical — it reflects the live state of the Starlink constellation today.

The above chart shows the estimated average throughput of Starlink Direct-2-Dish across the United Kingdom, simulated over 72 hours using real orbital data from Celestrak. The values are expressed in Megabits per second (Mbps) and are presented as a heatmap, where higher throughput regions are shown in yellow and green, and lower values fade into blue and purple. The simulation incorporates actual satellite positions and coverage behavior from the three operational inclination shells currently providing Starlink service to the UK. Consistent with the signal strength, beam footprint density, and orbital track density, the best quality and most supplied capacity are available south of the 53°N inclination.
The strongest throughput is concentrated in a horizontal band stretching from Birmingham through London to the southeast, as well as westward into Bristol and south Wales. In this region, the estimated average throughput peaks at over 3,000 Mbps, which can support more than 30 concurrent customers each demanding 100 Mbps within the coverage area or up to 600 households with an oversubscription rate of 1 to 20. This aligns closely with the signal strength and beam density maps also generated in this simulation and is driven by the dense satellite traffic of the 53° inclination shell. These satellites pass frequently over southern and central England, where their beams overlap tightly and revisit times are short. The availability of multiple beams from different satellites at nearly all times drives up the aggregate throughput experienced at ground level. Throughput falls off sharply beyond approximately 54°N. In Scotland and Northern Ireland, values typically stay well below 1,000 Mbps. This reduction directly reflects the sparser presence of higher-latitude satellites from the 70° and 97.6° shells, which are fewer in number and more widely spaced, resulting in lower revisit frequencies and broader, less concentrated beams. The throughput map thus offers a performance-level confirmation of the underlying orbital dynamics and coverage limitations seen in the satellite and beam footprint charts.
While the above map estimates throughput in realistic terms, it is essential to understand why it does not reflect the theoretical maximum performance implied by Starlink's physical layer capabilities. For example, a Starlink V1.5 satellite supports eight user downlink channels, each with 250 MHz of bandwidth, which in theory amounts to a total of 2 GHz of spectrum. Similarly, if one assumes 24 beams, each capable of delivering 800 Mbps, that would suggest a satellite capacity in the range of approximately 19–20 Gbps. However, these peak figures assume an ideal case with full spectrum reuse and optimized traffic shaping. In practice, the estimated average throughput shown here is the result of modeling real beam overlap and steering constraints, satellite pass timing, ground coverage limits, and the fact that not all beams are always active or directed toward the same location. Moreover, local beam capacity is shared among users and dynamically managed by the constellation. Therefore, the chart reflects a realistic, time-weighted throughput for a given geographic location, not a per-satellite or per-user maximum. It captures the outcome of many beams intermittently contributing to service across 72 hours, modulated by orbital density and beam placement strategy, rather than theoretical peak link rates.
A valuable next step in advancing the simulation model would be the integration of empirical user experience data across the UK footprint. If datasets such as comprehensive Ookla performance measurements (e.g., Starlink-specific download and upload speeds, latency, and jitter) were available with sufficient geographic granularity, the current Python model could be calibrated and validated against real-world conditions. Such data would enable the adjustment of beam throughput assumptions, satellite visibility estimates, and regional weighting factors to better reflect the actual service quality experienced by users. This would enhance the model’s predictive power, not only in representing average signal and throughput coverage, but also in identifying potential bottlenecks, underserved areas, or mismatches between orbital density and demand.
It is also important to note that this work relies on a set of simplified heuristics for beam steering, which are designed to make the simulation both tractable and transparent. In this model, beams are steered within a fixed angular distance from each satellite's subpoint, with probabilistic biases against cities and simple exclusion zones (i.e., I operate with an exclusion radius of approximately 25 km or more). However, in reality, Starlink’s beam steering logic is expected to be substantially more advanced, employing dynamic optimization algorithms that account for real-time demand, user terminal locations, traffic load balancing, and satellite-satellite coordination via laser interlinks. Starlink has the crucial (and obvious) operational advantage of knowing exactly where its customers are, allowing it to direct capacity where it is needed most, avoid congestion (to an extent), and dynamically adapt coverage strategies. This level of real-time awareness and adaptive control is not replicated in this analysis, which assumes no knowledge of actual user distribution and treats all geographic areas equally.
As such, the current Python code provides a first-order geographic approximation of Starlink coverage and capacity potential, not a reflection of the full complexity and intelligence of SpaceX’s actual network management. Nonetheless, it offers a valuable structural framework that, if calibrated with empirical data, could evolve into a much more powerful tool for performance prediction and service planning.

The decline in real-world median user speeds, observed in the chart above, particularly from Q4 2023 to Q3 2024, may reflect increasing congestion and uneven coverage relative to demand, especially in areas outside the dense beam zones of the 53° inclination shell. This trend supports the simulation's findings: while orbital geometry enables strong average coverage in the southern UK, northern regions rely on less frequent satellite passes from higher-inclination shells, which limits performance. The recovery of the median speed in Q4 2024 could be indicative of new satellite deployments (e.g., more V2 Minis or V2 Fulls) beginning to ease capacity constraints, something future simulation extensions could model by incorporating launch timelines and constellation updates.
THE 200 BILLION EUROS QUESTION - IS THERE A PATH TO A EUROPEAN SPACE INDEPENDENCE?
Let's start with the answer! Yes!
Is €200 billion, the estimated amount required to close the EU28 gigabit gap between 2023 and 2030, likely to enable Europe to build its own LEO satellite constellation and potentially develop one that is more secure, inclusive, and strategically aligned with its values and geopolitical objectives? In comparison, the European Union's IRIS² (Infrastructure for Resilience, Interconnectivity and Security by Satellite) program has been allocated a total budget of 10+ billion euros aiming at building 264 LEO satellites (1,200 km) and 18 MEO satellites (8,000 km) mainly by the European "Primes" (i.e., the usual "suspects" of legacy defense contractors) by 2030. For that amount, we should even be able to afford our dedicated European stratospheric drone program for real-world use cases, as opposed to, for example, Airbus's (AALTO) Zephyr fragile platform, which, imo, is more an impressive showcase of an innovative, sustainable (solar-driven) aerial platform than a practical, robust, high-performance communications platform.
A significant portion of this budget should be dedicated to designing, manufacturing, and launching a European-based satellite constellation. If Europe could match the satellite cost price of SpaceX, and not that of IRIS² (which appears to be large based on legacy satellite platform thinking or at least the unit price tag is), it could launch a very substantial number of EU-based LEO satellites within 200 billion euros (also for a lot less obviously). It easily matches the number of SpaceX’s long-term plans and would vastly surpass the satellites authorized under Kuiper’s first phase. To support such a constellation, Europe must invest heavily in launch infrastructure. While Ariane 6 remains in development, it could be leveraged to scale up the Ariane program or develop a reusable European launch system, mirroring and improving upon the capabilities of SpaceX’s Starship. This would reduce long-term launch costs, boost autonomy, and ensure deployment scalability over the decade. Equally essential would be establishing a robust ground segment covering the deployment of a European-wide ground station network, edge nodes, optical interconnects, and satellite laser communication capabilities.
Unlike Starlink, which benefits from SpaceX’s vertical integration, and Kuiper, which is backed by Amazon’s capital and logistics empire, a European initiative would rely heavily on strong multinational coordination. With 200 billion euros, possibly less if the usual suspects (i.e., " Primes") are managed accordingly, Europe could close the technology gap rapidly, secure digital sovereignty, and ensure that it is not dependent on foreign providers for critical broadband infrastructure, particularly for rural areas, government services, and defense.
Could this be done by 2030? Doubtful, unless Europe can match SpaceX's impressive pace of innovation. That is at least to match the 3 years (2015–2018) it took SpaceX to achieve a fully reusable Falcon 9 system and the 4 years (2015–2019) it took to go from concept to the first operational V1 satellite launch. Elon has shown it is possible.
KEY TAKEAWAYS.
LEO satellite direct-to-dish broadband, when strategically deployed in underserved and hard-to-reach areas, should be seen not as a competitor to terrestrial networks but as a strategic complement. It provides a practical, scalable, and cost-effective means to close the final connectivity gap, one that terrestrial networks alone are unlikely to bridge economically. In sparsely populated rural zones, where fiber deployment becomes prohibitively expensive, LEO satellites may render new rollouts obsolete. In these cases, satellite broadband is not just an alternative. It may be essential. Moreover, it can also serve as a resilient backup in areas where rural fiber is already deployed, especially in regions lacking physical network redundancy. Rather than undermining terrestrial infrastructure, LEO extends its reach, reinforcing the case for hybrid connectivity models central to achieving EU-wide digital reach by 2030.
Instead of continuing to subsidize costly last-mile fiber in uneconomical areas, European policy should reallocate a portion of this funding toward the development of a sovereign European Low-Earth Orbit (LEO) satellite constellation. A mere 200 billion euros, or even less, would go a very long way in securing such a program. Such an investment would not only connect the remaining “unconnectables” more efficiently but also strengthen Europe’s digital sovereignty, infrastructure resilience, and strategic autonomy. A European LEO system should support dual-use applications, serving both civilian broadband access and the European defense architecture, thereby enhancing secure communications, redundancy, and situational awareness in remote regions. In a hybrid connectivity model, satellite broadband plays a dual role: as a primary solution in hard-to-reach zones and as a high-availability backup where terrestrial access exists, reinforcing a layered, future-proof infrastructure aligned with the EU’s 2030 Digital Decade objectives and evolving security imperatives.
Non-European dependence poses strategic trade-offs: The rise of LEO broadband providers, SpaceX, and China’s state-aligned Guowang and Qianfan, underscores Europe's limited indigenous capacity in the Low Earth Orbit (LEO) space. While non-EU options may offer faster and cheaper rural connectivity, reliance on foreign infrastructure raises concerns about sovereignty, data governance, and security, especially amid growing geopolitical tensions.
LEO satellites, especially those similar or more capable than Starlink V3, can technically support the connectivity needs of Europe’s 2030s “unconnectable” (rural) households. Due to geography or economic constraints, these homes are unlikely to be reached by FTTP even under the most ambitious business-as-usual scenarios. A constellation of high-capacity satellites could serve these households with gigabit-class connections, especially when factoring in user concurrency and reasonable uptake rates.
The economics of FTTP deployment sharply deteriorate in very low-density rural regions, reinforcing the need for alternative technologies. By 2030, up to 5.5 million EU28 households are projected to remain beyond the economic viability of FTTP, down from 15.5 million rural homes in 2023. The European Commission has estimated that closing the gigabit gap from 2023 to 2030 requires around €200 billion. LEO satellite broadband may be a more cost-effective alternative, particularly with direct-to-dish architecture, at least for the share of unconnectable homes.
While LEO satellite networks offer transformative potential for deep rural coverage, they do not pose a threat to existing FTTP deployments. A Starlink V3 satellite, despite its 1 Tbps capacity, can serve the equivalent of a small fiber network, about 1,000 homes at 1 Gbps under full concurrency, or roughly 20,000 homes with 50% uptake and 10% busy-hour concurrency. FTTP remains significantly more efficient and scalable in denser areas. Satellites are not designed to compete with fiber in urban or suburban regions, but rather to complement it in places where fiber is uneconomical or otherwise unviable.
The technical attributes of LEO satellites make them ideally suited for sparse, low-density environments. Their broad coverage area and increasingly sophisticated beamforming and frequency reuse capabilities allow them to efficiently serve isolated dwellings, often spread across tens of thousands of square kilometers, where trenching fiber would be infeasible. These technologies extend the digital frontier rather than replace terrestrial infrastructure. Even with SpaceX's innovative pace, it seems unlikely that this conclusion will change substantially within the next five years, at the very least.
A European LEO constellation could be feasible within a € 200 billion budget: The €200 billion gap identified for full gigabit coverage could, in theory, fund a sovereign European LEO system capable of servicing the “unconnectables.” If Europe adopts leaner, vertically integrated innovation models like SpaceX (and avoids legacy procurement inefficiencies), such a constellation could deliver comparable technical performance while bolstering strategic autonomy.
The future of broadband infrastructure in Europe lies in a hybrid strategy. Fiber and mobile networks should continue to serve densely populated areas, while LEO satellites, potentially supplemented by fixed wireless and 5G, offer a viable path to universal coverage. By 2030, a satellite constellation only slightly more capable than Starlink V3 could deliver broadband to virtually all of Europe’s remaining unconnected homes, without undermining the business case for large-scale FTTP networks already in place.
CAUTIONARY NOTE.
While current assessments suggest that a LEO satellite constellation with capabilities on par with or slightly exceeding those anticipated for Starlink V3 could viably serve Europe's remaining unconnected households by 2030, it is important to acknowledge the speculative nature of these projections. The assumptions are based on publicly available data and technical disclosures. Still, it is challenging to have complete visibility into the precise specifications, performance benchmarks, or deployment strategies of SpaceX’s Starlink satellites, particularly the V3 generation, or, for that matter, Amazon’s Project Kuiper constellation. Much of what is known comes from regulatory filings (e.g., FCC), industry reports and blogs, Reddit, and similar platforms, as well as inferred capabilities. Therefore, while the conclusions drawn here are grounded in credible estimates and modeling, they should be viewed with caution until more comprehensive and independently validated performance data become available.
THE SATELLITE'S SPECS - MOST IS KEPT A "SECRET", BUT THERE IS SOME LIGHT.
Satellite capacity is not determined by a single metric, but instead emerges from a tightly coupled set of design parameters. Variables such as spectral efficiency, channel bandwidth, polarization, beam count, and reuse factor are interdependent. Knowing a few of them allows us to estimate, bound, or verify others. This is especially valuable when analyzing or validating constellation design, performance targets, or regulatory filings.
For example, consider a satellite that uses 250 MHz channels with 2 polarizations and a spectral efficiency of 5.0 bps/Hz. These inputs directly imply a channel capacity of 1.25 Gbps and a beam capacity of 2.5 Gbps. If the satellite is intended to deliver 100 Gbps of total throughput, as disclosed in related FCC filings, one can immediately deduce that 40 beams are required. If, instead, the satellite's reuse architecture defines 8 x 250 MHz channels per reuse group with a reuse factor of 5, and each reuse group spans a fixed coverage area. Both the theoretical and practical throughput within that area can be computed, further enabling the estimation of the total number of beams, the required spectrum, and the likely user experience. These dependencies mean that if the number of user channels, full bandwidth, channel bandwidth, number of beams, or frequency reuse factor is known, it becomes possible to estimate or cross-validate the others. This helps identify design consistency or highlight unrealistic assumptions.
In satellite systems like Starlink, the total available spectrum is limited. This is typically divided into discrete channels, for example, eight 250 MHz channels (as is the case for Starlink's Ku-band downlink to the user's terrestrial dish). A key architectural advantage of spot-beam satellites (e.g., with spots that are at least 50 to 80 km wide) is that frequency channels can be reused in multiple spatially separated beams, as long as the beams do not interfere with one another. This is not based on a fixed reuse factor, as seen in terrestrial cellular systems, but on beam isolation, achieved through careful beam shaping, angular separation, and sidelobe control (as also implemented in the above Python code for UK Starlink satellite coverage, albeit in much simpler ways). For instance, one beam covering southern England can use the same frequency channels as another beam covering northern Scotland, because their energy patterns do not overlap significantly at ground level. In a constellation like Starlink’s, where hundreds or even thousands of beams are formed across a satellite footprint, frequency reuse is achieved through simultaneous but non-overlapping spatial beam coverage. The reuse logic is handled dynamically on board or through ground-based scheduling, based on real-time traffic load and beam geometry.
This means that for a given satellite, the total instantaneous throughput is not only a function of spectral efficiency and bandwidth per beam, but also of the number of beams that can simultaneously operate on overlapping frequencies without causing harmful interference. If a satellite has access to 2 GHz of bandwidth and 250 MHz channels, then up to 8 distinct channels can be formed. These channels can be replicated across different beams, allowing many more than 8 beams to be active concurrently, each using one of those 8 channels, as long as they are separated enough in space. This approach allows operators to scale capacity dramatically through dense spatial reuse, rather than relying solely on expanding spectrum allocations. The ability to reuse channels across beams depends on antenna performance, beamwidth, power control, and orbital geometry, rather than a fixed reuse pattern. The same set of channels is reused across non-interfering coverage zones enabled by directional spot beams. Satellite beams can be "stacked on top of each other" up to the number of available channels, or they can be allocated optimally across a coverage area determined by user demand.
Although detailed specifications of commercial satellites, whether in operation or in the planning phase, are usually not publicly disclosed. However, companies are required to submit technical filings to the U.S. Federal Communications Commission (FCC). These filings include orbital parameters, frequency bands in use, EIRP, and antenna gain contours, as well as estimated capabilities of the satellite and user terminals. The FCC’s approval of SpaceX’s Gen2 constellation, for instance, outlines many of these values and provides a foundation upon which informed estimates of system behavior and performance can be made. The filings are not exhaustive and may omit sensitive performance data, but they serve as authoritative references for bounding what is technically feasible or likely in deployment.
ACKNOWLEDGEMENT.
I would like to acknowledge my wife, Eva Varadi, for her unwavering support, patience, and understanding throughout the creative process of writing this article.
FURTHER READINGS.
Kim K. Larsen, "Will LEO Satellite Direct-to-Cellular Networks Make Traditional Mobile Networks Obsolete?", A John Strand Consult Report, (January 2025). This has also been published in full on my own Techneconomy blog.
Kim K. Larsen, “The Next Frontier: LEO Satellites for Internet Services.” Techneconomyblog (March 2024).
Kim K. Larsen, “Stratospheric Drones & Low Earth Satellites: Revolutionizing Terrestrial Rural Broadband from the Skies?” Techneconomyblog (January 2024).
Kim K. Larsen, “A Single Network Future“, Techneconomyblog (March 2024).
NOTE: My "Satellite Coverage Concept Model," which I have applied to Starlink Direct-2-Dish coverage and Services in the United Kingdom, is not limited to the UK alone but can be straightforwardly generalized to other countries and areas.
Source: Can LEO Satellites close the Gigabit Gap of Europe's Unconnectables?

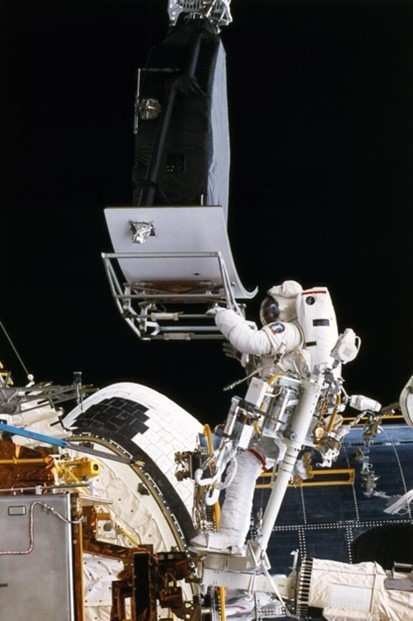
Hubble Space Telescope: Exploring the Cosmos and Making Life Better on Earth
In the 35 years since its launch aboard space shuttle Discovery, the Hubble Space Telescope has provided stunning views of galaxies millions of light years away. But the leaps in technology needed for its look into space has also provided benefits on the ground. Here are some of the technologies developed for Hubble that have improved life on Earth.

Image Sensors Find Cancer
Charge-coupled device (CCD) sensors have been used in digital photography for decades, but Hubble’s Space Telescope Imaging Spectrograph required a far more sensitive CCD. This development resulted in improved image sensors for mammogram machines, helping doctors find and treat breast cancer.
Laser Vision Gives Insights
In preparation for a repair mission to fix Hubble’s misshapen mirror, Goddard Space Flight Center required a way to accurately measure replacement parts. This resulted in a tool to detect mirror defects, which has since been used to develop a commercial 3D imaging system and a package detection device now used by all major shipping companies.

Optimized Hospital Scheduling
A computer scientist who helped design software for scheduling Hubble’s observations adapted it to assist with scheduling medical procedures. This software helps hospitals optimize constantly changing schedules for medical imaging and keep the high pace of emergency rooms going.

Optical Filters Match Wavelengths and Paint Swatches
For Hubble’s main cameras to capture high-quality images of stars and galaxies, each of its filters had to block all but a specific range of wavelengths of light. The filters needed to capture the best data possible but also fit on one optical element. A company contracted to construct these filters used its experience on this project to create filters used in paint-matching devices for hardware stores, with multiple wavelengths evaluated by a single lens.
Make sure to follow us on Tumblr for your regular dose of space!

Rosette Nebula
The large but sparsely populated constellation Monoceros, barely visible to the naked eye, can take pride in hosting an extraordinary treasure: the Rosette Nebula. Monoceros is a relatively recent addition to the star map. Lacking bright stars, astronomers of the pre-telescope era deemed this region unworthy of a constellation. After all, how could a constellation exist without luminous stars? A few 4th-magnitude stars hardly suffice to form a recognizable figure. Consequently, old star maps depicted nothing within the Winter Triangle — formed by Betelgeuse, Sirius, and Procyon (between the constellations Orion, Canis Major, and Canis Minor. Only with the telescope’s invention did it become clear that this region contained notable objects, necessitating a name. Johannes Hevelius, creator of a stunning star atlas, coined the name in the early 18th century. Thus, astronomers gradually accepted a mythical, horse-like beast with a sharp horn — located where the third eye might be — among the winter constellations.
Through this nearly starless constellation runs the broadest and brightest part of the winter Milky Way. Where the Milky Way flows, fascinating objects abound: open star clusters (plentiful in Monoceros), double and multiple stars, variable stars, and, of course, nebulae. Nebulae become visible only when illuminated by bright, hot stars with intense ultraviolet radiation. The Rosette Nebula owes its visibility to the young, hot open star cluster NGC 2244, nestled within a vast, dense hydrogen cloud. This cluster, also known as the “Satellite Cluster,” likely formed from this cloud about 5 million years ago.
The cluster boasts several Class O giant stars, each with a mass 50–60 times that of the Sun and a luminosity 500,000 times greater — an almost unimaginable power. These stars generate a stellar wind so intense that it ionizes the surrounding hydrogen clouds, causing them to glow and rapidly disperse, heating to 6 million degrees Kelvin. This accounts for the Rosette Nebula’s concentric shape, somewhat resembling a planetary nebula, with similar expansive dynamics. However, its scale and nature differ fundamentally. Planetary nebulae are the shed layers of dying stars, whereas the Rosette is a stellar nursery. Star formation is particularly active where the shockwave of escaping gases meets dormant hydrogen clouds, creating dense regions that collapse under gravity to form new stars. The visible Rosette Nebula is merely a portion of a larger hydrogen cloud, heated by blue giants and stretching along this arm of the Milky Way.
The visible portion of the Rosette Nebula lies 5,000 light-years from Earth, with a diameter of approximately 150 light-years. Dense hydrogen clouds extend far beyond its central region. The glowing material, vividly captured in colorful astrophotographs, has a mass equivalent to about 10,000 Suns, capable of birthing a similar number of stars for our Galaxy.
Despite its beauty and photogenic allure, the Rosette Nebula is challenging to observe visually. Astronomers discovered it piecemeal, with its fragments cataloged separately in the New General Catalogue as NGC 2237, NGC 2238, NGC 2239, and others. No one has likely seen through a telescope this nebula with the vivid details revealed in photographs, including those by amateurs. The nebula’s integrated stellar magnitude is only 9m — relatively faint — and its light is spread across an area of 1.5 x 1 degree, equivalent to six lunar disks. This vast expanse may not fit within a telescope’s field of view. Astrophotographers capture the Rosette by accumulating its light over hours or days, using narrow-band filters to isolate emissions from specific elements. As hydrogen dominates there, the nebula’s natural color is red. However, using filters for oxygen (present in smaller amounts) renders it in turquoise hues.
The astrophotograph inspiring the video illustration for this article was captured by Australian amateur astronomer Dylan O’Donnell, using filters highlighting hydrogen, oxygen, and sulfur emissions.
Musical accompaniment
The album «Asteroid Belt»: https://klimkovsky.bandcamp.com/album/asteroid-belt
Original Image:

Rosette Nebula by Dylan O'Donnell
Link to original image: Dylan O’Donnell (@erfmufn) on X
Carina Nebula
The term "Carina Nebula" is sometimes translated as "Nebula of Carina," evoking the image of a beautiful female name. However, this is a misinterpretation. "Carina" is Latin for "keel," referring to the keel of a ship—not just any ship, but the Argo, depicted on ancient star maps. Over time, the Argo constellation was divided into several modern constellations: Carina, Puppis, Vela, and Pyxis (Compass). The stars of the Argo are invisible from mid-northern latitudes. Even in the best seasons (winter and spring), Carina, Puppis, and Vela remain below the horizon. They can be observed from the northern tropics and farther south. However, in ancient times, when Greek astronomers imagined the Argo in the sky, the Earth's rotational axis was positioned differently due to precession. This allowed the Argo to be visible from Mediterranean shores. Precession, a gradual shift in the Earth's axis, completes a full cycle every 26,000 years. Over three millennia, the stars of the Argo gradually disappeared from the northern sky.
Carina is the southernmost constellation in this group. When Renaissance astronomers studied the heavens, they could not observe this remarkable nebula until the Age of Great Geographical Discoveries brought explorers to the Southern Hemisphere. The Carina Nebula was discovered in 1752 by Nicolas-Louis de Lacaille, a French astronomer, surveyor, and abbot, from the Cape of Good Hope at the southern tip of Africa.
The Carina Nebula is one of the brightest nebulae in the sky, possibly the brightest. Its integrated brightness is equivalent to a first-magnitude star, outshining the Andromeda Galaxy (formerly known as the Andromeda Nebula), the Orion Nebula, and even the Pleiades star cluster. Remarkably, the Carina Nebula lies approximately 8,500 light-years away—six times farther than the Orion Nebula. How does it achieve such brilliance?
The gas within the nebula, primarily hydrogen, does not glow on its own. It is energized by stars born within the nebula from the same gas. The Carina Nebula hosts numerous supermassive, extremely hot stars. Their ultraviolet radiation excites hydrogen atoms, ionizing them by breaking the bond between the proton and electron. In this process, the original photon is absorbed, and two lower-energy photons are emitted, contributing to the nebula's glow. Over time, a free electron and proton in the ionized gas recombine to form a neutral hydrogen atom, releasing another photon. However, ultraviolet radiation from nearby stars soon re-ionizes the atom, perpetuating the cycle. Thus, emission nebulae like Carina glow as long as bright, hot stars illuminate them. The Carina Nebula is particularly radiant due to its abundance of such stars.
Dust nebulae, by contrast, glow differently. They reflect light that reaches them or absorb light if positioned between an observer and a bright emission nebula, appearing as dark filaments against a luminous background. The Carina Nebula contains dust clouds that create its distinctive "relief" and intricate details, which astronomers have categorized into smaller regions: the Keyhole, the Defiant Finger, the Homunculus, and Mystic Mountain, among others. The nebula spans more than 4 square degrees in the sky—equivalent to 25 full Moon disks—and extends over 500 light-years in space. Throughout this vast region, new giant stars are born, and several bright, multi-star open clusters reside within it.
The most remarkable star in this region is Eta Carinae, a hypergiant. In astronomy, the brightest and most massive stars are called supergiants, but for Eta Carinae, even "super" is an understatement. Compared to other supergiants, it is unparalleled, with a mass 150 times that of the Sun and a luminosity 4 million times greater. Previously, astronomers believed such stars could not exist. However, several hypergiants have now been identified. These stars have short lifespans, rapidly burning out and culminating in a supernova. Eta Carinae is nearing the end of its life, with a supernova expected within the next few hundred thousand years.
The Carina Nebula is a favorite subject for astrophotographers, with countless stunning images available online. One of the finest amateur photographs was recently captured by Australian astronomy enthusiast Dylan O'Donnell. The video illustration for this article is based on his astrophotograph, accompanied by my music from the album «Asteroid Belt». While not directly inspired by the nebula, the track complements the visual imagery beautifully.
The album «Asteroid Belt» is here: https://klimkovsky.bandcamp.com/album/asteroid-belt

Carina Nebula by Dylan O'Donnell
Link to original image: Dylan O'Donnell (@erfmufn) on X
How to Find your Writing Style

Writing style - an author’s unique way of communicating with words.
An author creates a style with the voice, or personality, and overall tone that they apply to their text.
A writer’s style can change depending on the type of writing they’re doing, who they’re writing for, and their target audience.
A news journalist will have a very different style than a blogger, for example.
Elements of Any Writing Style
An author’s writing style is defined by 2 elements:
Voice: Voice is the personality you take on in your writing. It is the point of view through which you’re telling a story.
Tone: Tone is identified by the attitude that a piece of writing conveys. Writers create tone through elements like word choice, sentence structure, and grammar.
Types of Writing Styles
There are 4 main types of writing. While a writer will still incorporate their own voice in their writing, these different writing styles each have a purpose and specific audience, which dictates how an author should shape their copy:
Expository writing: Use an expository writing style to inform or explain a topic to readers. Examples of expository writing include technical writing, business writing, high school essays, and news articles.
Descriptive writing: Descriptive writing uses figurative language and sensory detail to describe a person, place, or thing to allow readers to create a picture in their mind. Descriptive writing is the style of writing most often found in poetry.
Narrative writing: Narrative style is writing that tells a story and includes elements often found in a novel or short story, like the main character, setting, and plot. It is most often used in fiction writing. Examples of narrative writing style include The Catcher in the Rye, The Color Purple, and The Lord of the Rings.
Persuasive writing: When you use a persuasive writing style, you communicate your opinion to try to influence the reader to adopt your stance on a subject. Examples of persuasive writing include cover letters, advertising campaigns, political speeches, and editorials.
Tips for Developing Your Writing Style
Whether you’re writing a novel or an article, you need a unique writing style that is distinctly you. Follow these general guidelines to help you find that style and develop your writing voice and tone:
Be original. Focus on the point you are trying to make and say it as only you can. Avoid using clichés—they lack creativity and originality and imply that you can’t think of anything else to write. Choose language that reflects both who you are and who you’re writing for.
Use your life experiences. The accumulation of unique experiences in your life have given you a distinct point of view. Incorporate that into your writing process. Let events in real life that have shaped you also inform your own work and voice.
Be present in your writing. Whether you’re developing a narrative storyline or writing a blog post, immerse readers in your story by being present when you write. Use an authentic tone. Use efficient syntax to effectively convey the details of your story.
Have an adaptable voice. While you should have a confident and consistent voice, writing styles should shift depending on what type of writing you’re doing. Different genres will work better with different types of writing styles. In creative writing, your personality will shift depending on the narrator’s perspective, and whether the story is told through first person or third person. Writing narratives with heavy dialogue, like screenplays, will require a writer to take on different styles with each character.
Step out of your comfort zone. Don't be afraid to experiment a little in your writing. While your style should reflect who you are, it should also stretch the limits of your literary personality. Incorporate a variety of literary devices to amplify your voice.
Read other authors. William Faulkner. Margaret Atwood. Stephen King. Ernest Hemingway. Each author has a unique voice, tone, and overall writing style they developed over the course of their writing career. Read some of your favorite authors as well as famous writers you’re not yet familiar with, and focus on how they use words and compose sentences to tell a story.
Write often. Good writers have a regular writing habit. The more you write, the more your writer’s voice will come into focus. One method many writers use is to have a morning journal. This daily writing ritual requires a three-page, longhand, stream-of-consciousness writing exercise first thing every morning. You’ll develop better writing skills and find your own unique style.
Hone your craft. Once you feel like you have a handle on your personal style, consider these other, more technical ways you can further improve your writing style:
Tips for Improving Your Writing Style
To be a better writer, you need to know how to be direct and clear, while also putting your own stamp on your writing. Follow these 8 writing tips for improving your style:
Be direct in your writing. Good writing is clear and concise. Lose filler words, like unnecessary adverbs and prepositional phrases, simply take up space and weigh a sentence down. Say exactly what you mean in the most direct way.
Choose your words wisely. There are many ways to write a sentence, and there are different words you can choose to convey the same idea. Always choose the simpler of two words. Use familiar vocabulary instead of lofty words from the English language. Simple words are more direct and easier for all readers to understand. Use a thesaurus if you need a little help finding a replacement or an easier way to say something.
Short sentences are more powerful than long sentences. A story loses steam with wordiness. Short sentences are easier to comprehend, something that readers appreciate. Avoid trying to pack too much into a line. Every sentence should contain one thought or idea.
Write short paragraphs. Keep your paragraphs short and manageable. Each one should consist of sentences that support the same idea. Short paragraphs are easier to digest. They also create a more visually appealing layout on the page. Academic writing often consists of lengthier paragraphs, as they need more information to support each theme. In less formal writing, shorter paragraphs are the norm.
Always use the active voice. Use the active voice and adhere to subject-verb-object sentence structure. It’s the most direct path to making your point. With the active voice, the subject is doing something, which is more exciting than the passive voice, in which something is being done to the subject. The passive voice might be grammatically correct, but it creates long, complex sentences and is a weaker way of presenting information.
Review and edit your work. Proofreading your first draft should be the first step in your editing process before you hand your story over to a professional editor. Tighten your writing, check your word choice and sentence structure, and hone your voice to improve your style.
Use a natural, conversational tone. Your writing style relies on your own, unique voice. Communicate in your comfort zone. In other words, write like you converse. Shape ideas with your original thoughts and voice, and do your best to avoid clichés. Your writing style should reflect your personality.
Read famous authors. Pick up any book by Mark Twain, and you’ll know it’s his writing simply by the tone of the story and the words he uses. Great writers put a stamp on their writing with a signature style. Along with works of fiction, read Strunk and White’s famous style guide The Elements of Style. Learning how other writers create their style. Then do the same with your own writing.
Sources: 1 2 ⚜ More: Notes & References ⚜ Writing Resources PDFs
Asteroid 2024 YR4: The Last Cosmic Warning?

As of today, February 27, 2025, here’s what’s known about Asteroid 2024 YR4 based on the latest updates:
Asteroid 2024 YR4 is a Near-Earth Object (NEO) of the Apollo type, meaning its orbit crosses Earth’s path around the Sun. It was discovered on December 27, 2024, by the ATLAS telescope in Rio Hurtado, Chile, just two days after it made a close approach to Earth on December 25, 2024, passing about 828,800 kilometers away—roughly 2.15 times the distance to the Moon. This asteroid caught attention because initial calculations suggested a small but notable chance of it impacting Earth in the future.
Its size is estimated to be between 40 and 90 meters (130 to 300 feet) in diameter, with NASA refining this to around 55 meters (180 feet) based on an assumed reflectivity (albedo) of 0.154. That’s roughly comparable to the asteroid responsible for the 1908 Tunguska event, which flattened a vast area of Siberian forest. It’s not a "planet-killer" by any stretch—those are typically kilometers wide—but it’s large enough to cause significant regional damage, potentially wiping out a city if it hits land. If it hits the ocean, it could cause a gigantic tsunami, the consequences of which could be more significant, since the affected area would be extended coastal areas.
The asteroid’s composition is thought to be stony, likely an S-type (the most common among NEOs), though it could also be an L-type or K-type based on preliminary spectral analysis from telescopes like the Gran Telescopio Canarias and Lowell Discovery Telescope. It spins pretty fast, with a rotation period of about 19.5 minutes, and its brightness varies as it rotates, suggesting an elongated shape—possibly 1.4 times longer than it is wide.
As for its orbit, 2024 YR4 takes about 4 years to circle the Sun, with an inclination of 3.41 degrees relative to Earth’s orbit (almost in the plane of the ecliptic). It came closest to the Sun (perihelion) on November 22, 2024, before swinging by Earth. Its next close approach is expected on December 17, 2028, at a safer distance of around 8 million kilometers. However, the big focus has been on December 22, 2032, when early estimates gave it a chance of hitting Earth.
Speaking of that impact risk, it’s been a rollercoaster. When first assessed in late January 2025, the odds were around 1-2%. By mid-February, they peaked at 3.1% (a 1-in-32 chance, and this is the highest probability estimate of a collision for bodies of similar size and mass in history), earning it a Torino Scale rating of 3—meaning it warranted serious attention. But as more observations rolled in, particularly from February 19-20, the risk dropped sharply. NASA’s latest update, based on data up to February 26, 2025, pegs the impact probability for 2032 at just 0.0011% (1-in-91,000), effectively reducing its Torino rating to 0. This means it’s no longer considered a significant threat, though there’s still a slim 1.7% chance it could hit the Moon instead.
Why the change?
More telescope data—hundreds of observations from places like the Very Large Telescope in Chile and the Magdalena Ridge Observatory in New Mexico—helped shrink the uncertainty in its trajectory. By April 2025, it’ll be too far and faint for ground-based telescopes to track, disappearing from view until mid-2028. The James Webb Space Telescope is slated to study it in March-May 2025, which could nail down its size and properties even better.
If it did hit Earth (super unlikely now), it’d likely strike at 38,000 mph (17 km/sec), releasing about 8 megatons of energy—over 500 times the Hiroshima bomb’s yield. The “risk corridor” spans the eastern Pacific, northern South America, the Atlantic, Africa, the Arabian Sea, and South Asia. But given the odds, scientists are more excited about studying it than worrying. It’s been a great test for planetary defense systems, like NASA’s Sentry and the ESA’s monitoring efforts, showing how we can refine predictions over time.

![Since her death in 1979, the woman who discovered what the universe is made of has not so much as received a memorial plaque. Her newspaper obituaries do not mention her greatest discovery. […] Every high school student knows that Isaac Newton discovered gravity, that Charles Darwin discovered evolution, and that Albert Einstein discovered the relativity of time. But when it comes to the composition of our universe, the textbooks simply say that the most abundant atom in the universe is hydrogen. And no one ever wonders how we know.❞ — Jeremy Knowles, discussing the complete lack of recognition Cecilia Payne gets, even today, for her revolutionary discovery. (via alliterate) OH WAIT LET ME TELL YOU ABOUT CECILIA PAYNE • Cecilia Payne’s mother refused to spend money on her college education, so she won a scholarship to Cambridge. • Cecilia Payne completed her studies, but Cambridge wouldn’t give her a degree because she was a woman, so she said to heck with that and moved to the United States to work at Harvard. • Cecilia Payne was the first person ever to earn a Ph.D. in astronomy from Radcliffe College, with what Otto Strauve called “the most brilliant Ph.D. thesis ever written in astronomy.” • Not only did Cecilia Payne discover what the universe is made of, she also discovered what the sun is made of (Henry Norris Russell, a fellow astronomer, is usually given credit for discovering that the sun’s composition is different from the Earth’s, but he came to his conclusions four years later than Payne — after telling her not to publish). • Cecilia Payne is the reason we know basically anything about variable stars (stars whose brightness as seen from earth fluctuates). Literally every other study on variable stars is based on her work. • Cecilia Payne was the first woman to be promoted to full professor from within Harvard, and is often credited with breaking the glass ceiling for women in the Harvard science department and in astronomy, as well as inspiring entire generations of women to take up science. • Cecilia Payne is awesome and everyone should know her. (OP: Matthew Gardner)](https://64.media.tumblr.com/62252d2e0b47b6782fbd6ef350407812/5bd09b4ca294947e-d3/s500x750/58ae690a544239d5a7cdf38d6193c1e114d908a1.jpg)


Gene jump!
Seeing UV colors is common for butterflies, but in some species, it is a female-only power

So, you may or may not know that many butterflies can actually see in UV light. It is very cool and I'm definitely not jealous that they get extra colors. It's helpful to them because many flowers have UV patterns on them (invisible to us) that let the butterflies know that they're a good source of food. The plants get pollinated and the butterflies get to eat. Everybody wins. This is a simulated version of what butterflies might see when they look at a flower.

Some butterflies, such as the zebra longwing pictured above, only display this trait in females. Because of this, male and female butterflies will tend to visit different types of flowers. But scientists have just recently figured out how this difference came to be, evolutionarily speaking.
Obviously many species have sexually dimorphic traits, some more prominently than others. There are also cases in which one sex develops a trait that is just... less useful than the other, like this case with the UV vision. Almost all butterflies can see in the UV spectrum, so it follows that at some point in the evolutionary line the male zebra longwing butterflies lost that particular ability. There are multiple ways that this sort of thing can happen, and the article covers them briefly, but after sequencing the genome for these butterflies they found that none of those previously seen explanations were the case.
Basically, we already know the gene that causes UV vision in butterflies. It is called the opsin gene. In zebra longtail butterflies, this gene occurs on the chromosome W, which is the female sex chromosome. That means that sometime in history, this gene just jumped from a normal chromosome onto the female-only chromosome, and has locked the male butterflies out of this ability ever since. This is the first time we have seen a gene do a jump like that, and it is pretty cool.
But anyway, appreciate the girlpower of zebra longwing butterflies getting all the UV vision, and take a look at the study! It's free to read, which is really nice to see.
NASA released the clearest pictures yet of our neighbours in the solar system


Oh and of course us

Honourable mention
