evisno
89 posts
Latest Posts by evisno


In the garden. Värmland, Sweden (October 23, 2015).
‘아렌델’은 빅뱅 이후 첫 10억년 이내에 존재했던 별입니다. 우리 지구에 닿기까지 129억년이나 걸린 것이지요!
우리 태양보다 적어도 50배 크고, 몇백만 배 밝아요. 평소에는 지구에서 볼 수 없지만, 우리와 ‘아렌델’ 사이에 있는 은하단이 렌즈 역할을 했습니다!
A View into the Past

Our Hubble Space Telescope just found the farthest individual star ever seen to date!
Nicknamed “Earendel” (“morning star” in Old English), this star existed within the first billion years after the universe’s birth in the big bang. Earendel is so far away from Earth that its light has taken 12.9 billion years to reach us, far eclipsing the previous single-star record holder whose light took 9 billion years to reach us.
Though Earendel is at least 50 times the mass of our Sun and millions of times as bright, we’d normally be unable to see it from Earth. However, the mass of a huge galaxy cluster between us and Earendel has created a powerful natural magnifying glass. Astronomers expect that the star will be highly magnified for years.
Earendel will be observed by NASA’s James Webb Space Telescope. Webb's high sensitivity to infrared light is needed to learn more about this star, because its light is stretched to longer infrared wavelengths due to the universe's expansion.

I believe in free education, one that’s available to everyone; no matter their race, gender, age, wealth, etc… This masterpost was created for every knowledge hungry individual out there. I hope it will serve you well. Enjoy!
FREE ONLINE COURSES (here are listed websites that provide huge variety of courses)
Alison
Coursera
FutureLearn
open2study
Khan Academy
edX
P2P U
Academic Earth
iversity
Stanford Online
MIT Open Courseware
Open Yale Courses
BBC Learning
OpenLearn
Carnegie Mellon University OLI
University of Reddit
Saylor
IDEAS, INSPIRATION & NEWS (websites which deliver educational content meant to entertain you and stimulate your brain)
TED
FORA
Big Think
99u
BBC Future
Seriously Amazing
How Stuff Works
Discovery News
National Geographic
Science News
Popular Science
IFLScience
YouTube Edu
NewScientist
DIY & HOW-TO’S (Don’t know how to do that? Want to learn how to do it yourself? Here are some great websites.)
wikiHow
Wonder How To
instructables
eHow
Howcast
MAKE
Do it yourself
FREE TEXTBOOKS & E-BOOKS
OpenStax CNX
Open Textbooks
Bookboon
Textbook Revolution
E-books Directory
FullBooks
Books Should Be Free
Classic Reader
Read Print
Project Gutenberg
AudioBooks For Free
LibriVox
Poem Hunter
Bartleby
MIT Classics
Many Books
Open Textbooks BCcampus
Open Textbook Library
WikiBooks
SCIENTIFIC ARTICLES & JOURNALS
Directory of Open Access Journals
Scitable
PLOS
Wiley Open Access
Springer Open
Oxford Open
Elsevier Open Access
ArXiv
Open Access Library
LEARN:
1. LANGUAGES
Duolingo
BBC Languages
Learn A Language
101languages
Memrise
Livemocha
Foreign Services Institute
My Languages
Surface Languages
Lingualia
OmniGlot
OpenCulture’s Language links
2. COMPUTER SCIENCE & PROGRAMMING
Codecademy
Programmr
GA Dash
CodeHS
w3schools
Code Avengers
Codelearn
The Code Player
Code School
Code.org
Programming Motherf*?$%#
Bento
Bucky’s room
WiBit
Learn Code the Hard Way
Mozilla Developer Network
Microsoft Virtual Academy
3. YOGA & MEDITATION
Learning Yoga
Learn Meditation
Yome
Free Meditation
Online Meditation
Do Yoga With Me
Yoga Learning Center
4. PHOTOGRAPHY & FILMMAKING
Exposure Guide
The Bastards Book of Photography
Cambridge in Color
Best Photo Lessons
Photography Course
Production Now
nyvs
Learn About Film
Film School Online
5. DRAWING & PAINTING
Enliighten
Ctrl+Paint
ArtGraphica
Google Cultural Institute
Drawspace
DragoArt
WetCanvas
6. INSTRUMENTS & MUSIC THEORY
Music Theory
Teoria
Music Theory Videos
Furmanczyk Academy of Music
Dave Conservatoire
Petrucci Music Library
Justin Guitar
Guitar Lessons
Piano Lessons
Zebra Keys
Play Bass Now
7. OTHER UNCATEGORIZED SKILLS
Investopedia
The Chess Website
Chesscademy
Chess.com
Spreeder
ReadSpeeder
First Aid for Free
First Aid Web
NHS Choices
Wolfram Demonstrations Project
Please feel free to add more learning focused websites.
*There are a lot more learning websites out there, but I picked the ones that are, as far as I’m aware, completely free and in my opinion the best/ most useful.
Galaxies: Types and morphology
A galaxy is a gravitationally bound system of stars, stellar remnants, interstellar gas, dust, and dark matter. Galaxies range in size from dwarfs with just a few hundred million (108) stars to giants with one hundred trillion (1014) stars, each orbiting its galaxy’s center of mass.

Galaxies come in three main types: ellipticals, spirals, and irregulars. A slightly more extensive description of galaxy types based on their appearance is given by the Hubble sequence.

Since the Hubble sequence is entirely based upon visual morphological type (shape), it may miss certain important characteristics of galaxies such as star formation rate in starburst galaxies and activity in the cores of active galaxies.
Ellipticals

The Hubble classification system rates elliptical galaxies on the basis of their ellipticity, ranging from E0, being nearly spherical, up to E7, which is highly elongated. These galaxies have an ellipsoidal profile, giving them an elliptical appearance regardless of the viewing angle. Their appearance shows little structure and they typically have relatively little interstellar matter. Consequently, these galaxies also have a low portion of open clusters and a reduced rate of new star formation. Instead they are dominated by generally older, more evolved stars that are orbiting the common center of gravity in random directions.
Spirals

Spiral galaxies resemble spiraling pinwheels. Though the stars and other visible material contained in such a galaxy lie mostly on a plane, the majority of mass in spiral galaxies exists in a roughly spherical halo of dark matter that extends beyond the visible component, as demonstrated by the universal rotation curve concept.
Spiral galaxies consist of a rotating disk of stars and interstellar medium, along with a central bulge of generally older stars. Extending outward from the bulge are relatively bright arms. In the Hubble classification scheme, spiral galaxies are listed as type S, followed by a letter (a, b, or c) that indicates the degree of tightness of the spiral arms and the size of the central bulge.
Barred spiral galaxy

A majority of spiral galaxies, including our own Milky Way galaxy, have a linear, bar-shaped band of stars that extends outward to either side of the core, then merges into the spiral arm structure. In the Hubble classification scheme, these are designated by an SB, followed by a lower-case letter (a, b or c) that indicates the form of the spiral arms (in the same manner as the categorization of normal spiral galaxies).
Ring galaxy

A ring galaxy is a galaxy with a circle-like appearance. Hoag’s Object, discovered by Art Hoag in 1950, is an example of a ring galaxy. The ring contains many massive, relatively young blue stars, which are extremely bright. The central region contains relatively little luminous matter. Some astronomers believe that ring galaxies are formed when a smaller galaxy passes through the center of a larger galaxy. Because most of a galaxy consists of empty space, this “collision” rarely results in any actual collisions between stars.
Lenticular galaxy

A lenticular galaxy (denoted S0) is a type of galaxy intermediate between an elliptical (denoted E) and a spiral galaxy in galaxy morphological classification schemes. They contain large-scale discs but they do not have large-scale spiral arms. Lenticular galaxies are disc galaxies that have used up or lost most of their interstellar matter and therefore have very little ongoing star formation. They may, however, retain significant dust in their disks.
Irregular galaxy

An irregular galaxy is a galaxy that does not have a distinct regular shape, unlike a spiral or an elliptical galaxy. Irregular galaxies do not fall into any of the regular classes of the Hubble sequence, and they are often chaotic in appearance, with neither a nuclear bulge nor any trace of spiral arm structure.
Dwarf galaxy

Despite the prominence of large elliptical and spiral galaxies, most galaxies in the Universe are dwarf galaxies. These galaxies are relatively small when compared with other galactic formations, being about one hundredth the size of the Milky Way, containing only a few billion stars. Ultra-compact dwarf galaxies have recently been discovered that are only 100 parsecs across.
Interacting

Interactions between galaxies are relatively frequent, and they can play an important role in galactic evolution. Near misses between galaxies result in warping distortions due to tidal interactions, and may cause some exchange of gas and dust. Collisions occur when two galaxies pass directly through each other and have sufficient relative momentum not to merge.
Starburst

Stars are created within galaxies from a reserve of cold gas that forms into giant molecular clouds. Some galaxies have been observed to form stars at an exceptional rate, which is known as a starburst. If they continue to do so, then they would consume their reserve of gas in a time span less than the lifespan of the galaxy. Hence starburst activity usually lasts for only about ten million years, a relatively brief period in the history of a galaxy.
Active galaxy
A portion of the observable galaxies are classified as active galaxies if the galaxy contains an active galactic nucleus (AGN). A significant portion of the total energy output from the galaxy is emitted by the active galactic nucleus, instead of the stars, dust and interstellar medium of the galaxy.

The standard model for an active galactic nucleus is based upon an accretion disc that forms around a supermassive black hole (SMBH) at the core region of the galaxy. The radiation from an active galactic nucleus results from the gravitational energy of matter as it falls toward the black hole from the disc. In about 10% of these galaxies, a diametrically opposed pair of energetic jets ejects particles from the galaxy core at velocities close to the speed of light. The mechanism for producing these jets is not well understood.

The main known types are: Seyfert galaxies, quasars, Blazars, LINERS and Radio galaxy.
source
images: NASA/ESA, Hubble (via wikipedia)

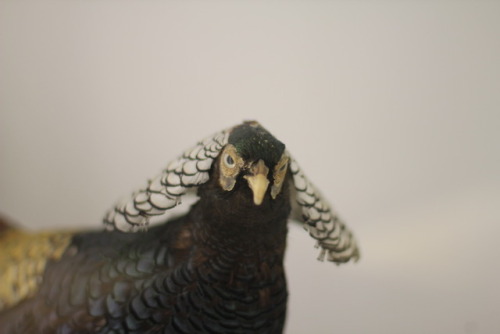
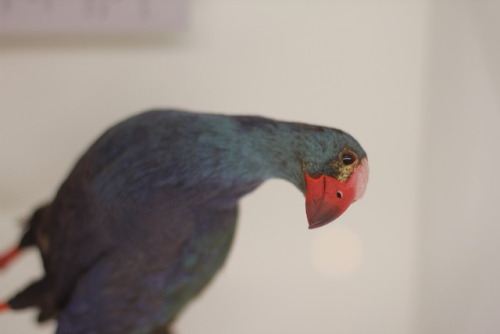


I visited Nantes’ Natural History Museum.
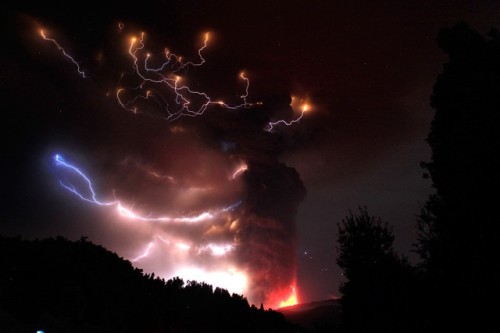

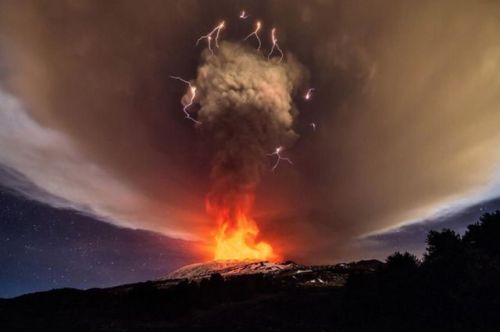
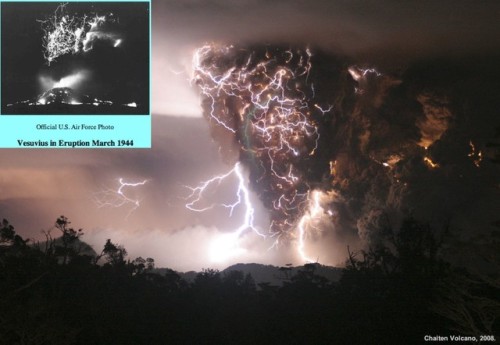

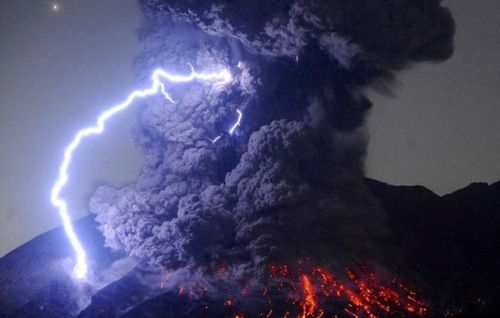
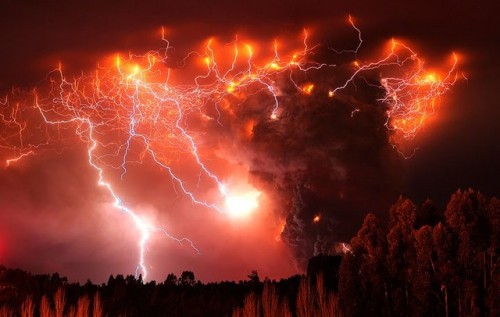
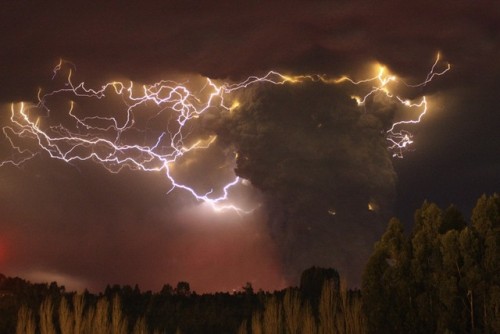
How Do Volcanoes Make Lightning?
“Volcanic lightning appears to occur most frequently around volcanoes with large ash plumes, particularly during active stages of the eruption, where flowing, molten lava creates the largest temperature gradients. The phenomena of lightning has been exquisitely recorded around a number of recent volcanic eruptions, including Iceland’s Eyjafjallajökull, Japan’s Sakurajima, Italy’s Mt. Etna, and Chile’s Puyehue, Calbuco and Chaiten volcanoes. But what you may not know is this phenomenon was not only captured during Mt. Vesuvius’ last eruption in 1944, but was accurately described nearly 2,000 years ago when it erupted all the way back in the year 79!”
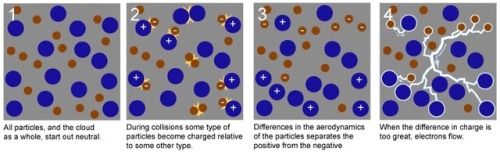
Volcanoes are some of the most potentially destructive natural phenomena known to occur on our world. The most violent eruptions feature not only lava, but soot, ash, volatile gases, and even enormous chunks of rock hurled great distances. What you might not realize, however, is just how frequently these eruptions are accompanied by another spectacular show: volcanic lightning. Lightning isn’t only found in thunderstorms or other great electrical discharges between the clouds and the ground, but is produced in volcanic eruptions all throughout the world, and throughout history as well. After countless generations, where we wondered what could produce such an unusual but spectacular show, we’ve finally figured it out.
Come get the science behind how volcanoes make lightning, and enjoy some of the greatest photographs of this phenomena humanity’s ever taken!


Métaphore d’un voyage initiatique au coeur de l’oreille adapté aux enfants :
- traversée de l’onde aérienne en avion à l’intérieur du conduit auditif jusqu’à la membrane du tympan
- découverte de l’onde mécanique sur la chaîne des osselets en vue de la fenêtre ovale
- plongée de l’onde de pression dans la cochlée qui contient l’organe de l’audition relié au cerveau

Outi on the couch - Sievänen, Jaakko 1974
Finnish,1932-2013
oil and tempera on canvas , 135,5 x 160,5 cm.

Uneasiness in Observers of Unnatural Android Movements Explained
It has been decades in the making, but humanoid technology has certainly made significant advancements toward creation of androids - robots with human-like features and capabilities. While androids hold great promise for tangible benefits to the world, they may induce a mysterious and uneasy feeling in human observers. This phenomenon, called the “uncanny valley,” increases when the android’s appearance is almost humanlike but its movement is not fully natural or comparable to human movement. This has been a focus of study for many years; however, the neural mechanism underlying the detection of unnatural movements remains unclear.
The research is in Scientific Reports. (full open access)


Polycephaly is the condition of having more than one head. Two-headed animals (called bicephalic or dicephalic) and three-headed (tricephalic) animals are the only type of multi-headed creatures seen in the real world, and form by the same process as conjoined twins from monozygotic twin embryos.
While two headed snakes are rare, they do occur in both the wild and in captivity at a rate of about 1 in 10,000 births. Most wild polycephalic snakes do not live long, but some captive individuals do. A two-headed black rat snake with separate throats and stomachs survived for 20 years.
(Sources: x x x x x x x x)


Ask Ethan: Could The Fabric Of Spacetime Be Defective?
“The topic I’d like to suggest is high-energy relics, like domain walls, cosmic strings, monopoles, etc… it would be great to read more about what these defects really are, what their origin is, what properties they likely have, or, and this is probably the most exciting part for me, how we expect them to look like and interact with the ‘ordinary’ universe.”
So, you’d like to ruin the fabric of your space, would you? Similar to tying a knot in it, stitching it up with some poorly-run shenanigans, running a two-dimensional membrane through it (like a hole in a sponge), etc., it’s possible to put a topological defect in the fabric of space itself. This isn’t just a mathematical possibility, but a physical one: if you break a symmetry in just the right way, monopoles, strings, domain walls, or textures could be produced on a cosmic scale. These could show up in a variety of ways, from abundant new, massive particles to a network of large-scale structure defects in space to a particular set of fluctuations in the cosmic microwave background. Yet when it comes time to put up or shut up, the Universe offers no positive evidence of any of these defects. Save for one, that is: back in 1982, there was an observation of one (and only one) event consistent with a magnetic monopole. 35 years later, we still don’t know what it was.
It’s time to investigate the possibilities, no matter how outlandish they seem, on this week’s Ask Ethan!

We’re used to radiation being invisible. With a Geiger counter, it gets turned into audible clicks. What you see above, though, is radiation’s effects made visible in a cloud chamber. In the center hangs a chunk of radioactive uranium, spitting out alpha and beta particles. The chamber also has a reservoir of alcohol and a floor cooled to -40 degrees Celsius. This generates a supersaturated cloud of alcohol vapor. When the uranium spits out a particle, it zips through the vapor, colliding with atoms and ionizing them. Those now-charged ions serve as nuclei for the vapor, which condenses into droplets that reveal the path of the particle. The characteristics of the trails are distinct to the type of decay particle that created them. In fact, both the positron and muon were first discovered in cloud chambers! (Image credit: Cloudylabs, source)
Willst du immer weiter schweifen? Sieh, das Gute liegt so nah!
Do you want to roam further and further? Look, the good things are so close!
Johann Wolfgang von Goethe (1749 – 1832), German poet, dramatist, natural scientist, and statesman
(via thatswhywelovegermany)
Habe Mut, dich deines eigenen Verstandes zu bedienen.
Have the courage to use your own mind.
Immanuel Kant (1724 – 1804), German philosopher
(via jedentageinzitat)
Solar System: Things to Know This Week
Mark your calendars for summer 2018: That’s when we’re launching a spacecraft to touch the sun.
In honor of our first-ever mission to the heart of the solar system, this week we’re delving into the life and times of this powerful yellow dwarf star.

1. Meet Parker
Parker Solar Probe, our first mission to go to the sun, is named after Eugene Parker, an American astrophysicist who first theorized that the sun constantly sends out a flow of particles and energy called the solar wind. This historic mission will explore one of the last regions of the solar system to be visited by a spacecraft and help scientists unlock answers to questions they’ve been pondering for more than five decades.

2. Extra SPF, Please
Parker Solar Probe will swoop within 4 million miles of the sun’s surface, facing heat and radiation like no spacecraft before it. The mission will provide new data on solar activity to help us better understand our home star and its activity - information that can improve forecasts of major space-weather events that could impact life on Earth.

3. Majorly Massive
The sun is the center of our solar system and makes up 99.8 percent of the mass of the entire solar system. If the sun were as tall as a typical front door, Earth would be about the size of a nickel.
4. Different Spin
Since the sun is not a solid body, different parts of the sun rotate at different rates. At the equator, the sun spins once about every 25 days, but at its poles the sun rotates once on its axis every 36 Earth days.

5. Can’t Stand on It
The sun is a star and a star doesn’t have a solid surface. Rather, it’s a ball of ionized gas 92.1% hydrogen (H2) and 7.8% helium (He) held together by its own gravity.
6. Center of Attention
The sun isn’t a planet, so it doesn’t have any moons. But, the sun is orbited by eight planets, at least five dwarf planets, tens of thousands of asteroids, and hundreds of thousands to trillions of comets and icy bodies.

7. It’s Hot in There
And we mean really, really hot. The temperature at the sun’s core is about 27 million degrees Fahrenheit. However, its atmosphere, the corona, can reach temperatures of 3 million degrees. (That’s as if it got hotter the farther away you got from a fire, instead of cooler!) Parker Solar Probe will help scientists solve the mystery of why the corona’s temperature is so much higher than the surface.

8. Travel Conditions
The sun influences the entire solar system, so studying it helps us better understand the space weather that our astronauts and spacecraft travel through.
9. Life on the Sun?
Better to admire from afar. Thanks to its hot, energetic mix of gases and plasma, the sun can’t be home to living things. However, we can thank the sun for making life on Earth possible by providing the warmth and energy that supply Earth’s food chain.
10. Chance of a Lifetime
Last but not least, don’t forget that the first total solar eclipse to sweep across the U.S. from coast-to-coast since 1918 is happening on August 21, 2017. Our toolkit has you need to know to about it.
Want to learn more? Read our full list of the 10 things to know this week about the solar system HERE.
Make sure to follow us on Tumblr for your regular dose of space: http://nasa.tumblr.com

The Great Nebula in Carina : In one of the brightest parts of Milky Way lies a nebula where some of the oddest things occur. NGC 3372, known as the Great Nebula in Carina, is home to massive stars and changing nebulas. The Keyhole Nebula , the bright structure just above the image center, houses several of these massive stars and has itself changed its appearance. The entire Carina Nebula spans over 300 light years and lies about 7,500 light-years away in the constellation of Carina. Eta Carinae, the most energetic star in the nebula, was one of the brightest stars in the sky in the 1830s, but then faded dramatically. Eta Carinae is the brightest star near the image center, just left of the Keyhole Nebula. While Eta Carinae itself maybe on the verge of a supernova explosion, X-ray images indicate that much of the Great Carina Nebula has been a veritable supernova factory. via NASA
js


We’re Way Below Average! Astronomers Say Milky Way Resides In A Great Cosmic Void
“If there weren’t a large cosmic void that our Milky Way resided in, this tension between different ways of measuring the Hubble expansion rate would pose a big problem. Either there would be a systematic error affecting one of the methods of measuring it, or the Universe’s dark energy properties could be changing with time. But right now, all signs are pointing to a simple cosmic explanation that would resolve it all: we’re simply a bit below average when it comes to density.”
When you think of the Universe on the largest scales, you likely think of galaxies grouped and clustered together in huge, massive collections, separated by enormous cosmic voids. But there’s another kind of cluster-and-void out there: a very large volume of space that has its own galaxies, clusters and voids, but is simply higher or lower in density than average. If our galaxy resided near the center of one such region, we’d measure the expansion rate of the Universe to be higher-or-lower than average when we used nearby techniques. But if we measured the global expansion rate, such as via baryon acoustic oscillations or the fluctuations in the cosmic microwave background, we’d actually arrive at the true, average rate.
We’ve been seeing an important discrepancy for years, and yet the cause might simply be that the Milky Way lives in a large cosmic void. The data supports it, too! Get the story today.

Transit of Venus
js


The Van Allen Belt & the South Atlantic Anomaly
NASA’s first satellite, launched in 1958, discovered two giant swaths of radiation encircling Earth. Five decades later, scientists are still trying to unlock the mysteries of these phenomena known as the Van Allen belt. The belt is named after its discoverer, American astrophysicist James Van Allen.
The near-Earth space environment is a complex interaction between the planet’s magnetic field, cool plasma moving up from Earth’s ionosphere, and hotter plasma coming in from the solar wind. This dynamic region is populated by charged particles (electrons and ions) which occupy regions known as the plasmasphere and the Van Allen radiation belt. As solar wind and cosmic rays carry fast-moving, highly energized particles past Earth, some of these particles become trapped by the planet’s magnetic field. These particles carry a lot of energy, and it is important to mention their energies when describing the belt, because there are actually two distinct belts; one with energetic electrons forming the outer belt, and a combination of protons and electrons creating the inner belt. The resulting belts, can swell or shrink in size in response to incoming particles from Earth’s upper atmosphere and changes in the solar wind. Recent studies suggest that there is boundary at the inner edge of the outer belt at roughly 7,200 miles in altitude that appears to block the ultrafast electrons from breaching the invisible shield that protects Earth.
Earth’s magnetic field doesn’t exactly line up with the planet’s rotation axis, the belts are actually tilted a bit. Because of this asymmetry, one of the shields that trap potentially harmful particles from space dips down to 200 km (124 mi) altitude.

This dip in the earth’s magnetic field allows charged particles and cosmic rays to reach lower into the atmosphere. Satellites and other low orbiting spacecraft passing through this region of space actually enter the Van Allen radiation belt and are bombarded by protons. Exposure to such radiation can wreak havoc on satellite electronics, and pose serious health risks to astronauts. This peculiar region is called the South Atlantic Anomaly.
Credit: NASA/ESA/M. Kornmesser


Drops of a liquid can often join a pool gradually through a process known as the coalescence cascade (top left). In this process, a drop sits atop a pool, separated by a thin air layer. Once that air drains out, contact is made and part of the drop coalesces. Then a smaller daughter droplet rebounds and the process repeats.
A recent study describes a related phenomenon (top right) in which the coalescence cascade is drastically sped up through the use of surfactants. The normal cascade depends strongly on the amount of time it takes for the air layer between the drop and pool to drain. By making the pool a liquid with a much greater surface tension value than the drop, the researchers sped up the air layer’s drainage. The mismatch in surface tension between the drop and pool creates an outward flow on the surface (below) due to the Marangoni effect. As the pool’s liquid moves outward, it drags air with it, thereby draining the separating layer more quickly. The result is still a coalescence cascade but one in which the later stages have no rebound and coalesce quickly. (Image and research credit: S. Shim and H. Stone, source)


“evolution is written on the wings of butterflies” - charles darwin
photos by linden gledhill of butterfly and moth wings, which are actually made up of thousands of tiny scales, at seven to ten times magnification (save the last).


5 Vital Lessons Scientists Learn That Can Better Everyone’s Life
“4. Following your intuition will never get you as far as doing the math will. Coming up with a beautiful, powerful and compelling theory is the dream of many scientists worldwide, and has been for as long as there have been scientists. When Copernicus put forth his heliocentric model, it was attractive to many, but his circular orbits couldn’t explain the observations of the planets as well as Ptolemy’s epicycles – ugly as they were – did. Some 50 years later, Johannes Kepler built upon Copernicus’ idea and put forth his Mysterium Cosmographicum: a series of nested spheres whose ratios could explain the orbits of the planets. Except, the data didn’t fit right. When he did the math, the numbers didn’t add up.”
There are a lot of myths we have in our society about how the greatest of all scientific advances happened. We think about a lone genius, working outside the constraints of mainstream academia or mainstream thinking, working on something no one else works on. That hasn’t ever really been true, and yet there are actual lessons – valuable ones – to be learned from observing scientists throughout history. The greatest breakthroughs can only happen in the context of what’s already been discovered, and in that sense, our scientific knowledge base and our best new theories are a reflection of the very human endeavor of science. When Newton claimed he was standing on the shoulders of giants, it may have been his most brilliant realization of all, and it’s never been more true today.
Come learn these five vital lessons for yourself, and see if you can’t find some way to have them apply to your life!
Celebrating 17 Years of NASA’s ‘Little Earth Satellite That Could’
The satellite was little— the size of a small refrigerator; it was only supposed to last one year and constructed and operated on a shoestring budget — yet it persisted.
After 17 years of operation, more than 1,500 research papers generated and 180,000 images captured, one of NASA’s pathfinder Earth satellites for testing new satellite technologies and concepts comes to an end on March 30, 2017. The Earth Observing-1 (EO-1) satellite will be powered off on that date but will not enter Earth’s atmosphere until 2056.
“The Earth Observing-1 satellite is like The Little Engine That Could,” said Betsy Middleton, project scientist for the satellite at NASA’s Goddard Space Flight Center in Greenbelt, Maryland.
To celebrate the mission, we’re highlighting some of EO-1’s notable contributions to scientific research, spaceflight advancements and society.
Scientists Learn More About Earth in Fine Detail

This animation shifts between an image showing flooding that occurred at the Arkansas and Mississippi rivers on January 12, 2016, captured by ALI and the rivers at normal levels on February 14, 2015 taken by the Operational Land Imager on Landsat 8. Credit: NASA’s Earth Observatory
EO-1 carried the Advanced Land Imager that improved observations of forest cover, crops, coastal waters and small particles in the air known as aerosols. These improvements allowed researchers to identify smaller features on a local scale such as floods and landslides, which were especially useful for disaster support.

On the night of Sept. 6, 2014, EO-1’s Hyperion observed the ongoing eruption at Holuhraun, Iceland as shown in the above image. Partially covered by clouds, this scene shows the extent of the lava flows that had been erupting.
EO-1’s other key instrument Hyperion provided an even greater level of detail in measuring the chemical constituents of Earth’s surface— akin to going from a black and white television of the 1940s to the high-definition color televisions of today. Hyperion’s level of sophistication doesn’t just show that plants are present, but can actually differentiate between corn, sorghum and many other species and ecosystems. Scientists and forest managers used these data, for instance, to explore remote terrain or to take stock of smoke and other chemical constituents during volcanic eruptions, and how they change through time.
Crowdsourced Satellite Images of Disasters

EO-1 was one of the first satellites to capture the scene after the World Trade Center attacks (pictured above) and the flooding in New Orleans after Hurricane Katrina. EO-1 also observed the toxic sludge in western Hungary in October 2010 and a large methane leak in southern California in October 2015. All of these scenes, which EO-1 provided quick, high-quality satellite imagery of the event, were covered in major news outlets. All of these scenes were also captured because of user requests. EO-1 had the capability of being user-driven, meaning the public could submit a request to the team for where they wanted the satellite to gather data along its fixed orbits.

This image shows toxic sludge (red-orange streak) running west from an aluminum oxide plant in western Hungary after a wall broke allowing the sludge to spill from the factory on October 4, 2010. This image was taken by EO-1’s Advanced Land Imager on October 9, 2010. Credit: NASA’s Earth Observatory
Artificial Intelligence Enables More Efficient Satellite Collaboration

This image of volcanic activity on Antarctica’s Mount Erebus on May 7, 2004 was taken by EO-1’s Advanced Land Imager after sensing thermal emissions from the volcano. The satellite gave itself new orders to take another image several hours later. Credit: Earth Observatory
EO-1 was among the first satellites to be programmed with a form of artificial intelligence software, allowing the satellite to make decisions based on the data it collects. For instance, if a scientist commanded EO-1 to take a picture of an erupting volcano, the software could decide to automatically take a follow-up image the next time it passed overhead. The Autonomous Sciencecraft Experiment software was developed by NASA’s Jet Propulsion Laboratory in Pasadena, California, and was uploaded to EO-1 three years after it launched.

This image of Nassau Bahamas was taken by EO-1’s Advanced Land Imager on Oct 8, 2016, shortly after Hurricane Matthew hit. European, Japanese, Canadian, and Italian Space Agency members of the international coalition Committee on Earth Observation Satellites used their respective satellites to take images over the Caribbean islands and the U.S. Southeast coastline during Hurricane Matthew. Images were used to make flood maps in response to requests from disaster management agencies in Haiti, Dominican Republic, St. Martin, Bahamas, and the U.S. Federal Emergency Management Agency.
The artificial intelligence software also allows a group of satellites and ground sensors to communicate and coordinate with one another with no manual prompting. Called a “sensor web”, if a satellite viewed an interesting scene, it could alert other satellites on the network to collect data during their passes over the same area. Together, they more quickly observe and downlink data from the scene than waiting for human orders. NASA’s SensorWeb software reduces the wait time for data from weeks to days or hours, which is especially helpful for emergency responders.
Laying the Foundation for ‘Formation Flying’

This animation shows the Rodeo-Chediski fire on July 7, 2002, that were taken one minute apart by Landsat 7 (burned areas in red) and EO-1 (burned areas in purple). This precision formation flying allowed EO-1 to directly compare the data and performance from its land imager and the Landsat 7 ETM+. EO-1’s most important technology goal was to test ALI for future Landsat satellites, which was accomplished on Landsat 8. Credit: NASA’s Goddard Space Flight Center
EO-1 was a pioneer in precision “formation flying” that kept it orbiting Earth exactly one minute behind the Landsat 7 satellite, already in orbit. Before EO-1, no satellite had flown that close to another satellite in the same orbit. EO-1 used formation flying to do a side-by-side comparison of its onboard ALI with Landsat 7’s operational imager to compare the products from the two imagers. Today, many satellites that measure different characteristics of Earth, including the five satellites in NASA’s A Train, are positioned within seconds to minutes of one another to make observations on the surface near-simultaneously.
For more information on EO-1’s major accomplishments, visit: https://www.nasa.gov/feature/goddard/2017/celebrating-17-years-of-nasa-s-little-earth-satellite-that-could
Make sure to follow us on Tumblr for your regular dose of space: http://nasa.tumblr.com/.

That’s Electrooculography!
The eye is a basically a dipole ( a separation of electric charges )
It was observed by Reymond in 1848 that the cornea of the eye is electrically positive relative to the back of the eye.This potential was surprisingly not dependent on the amount of light falling on the eye.

The cornea is the transparent front part of the eye
Dipoles and Eye Tracking
This means that as the eye moves from side to side, the dipole moves as well. To capture the movement of the dipole, one places two electrodes on both sides of the eye. ( like the one placed on this guy )

If the eye moves from the center position to the right, one of the electrodes becomes slightly positive and the other negative. This leads to a spike in the positive direction.

Source
And if the eye moves from the center position to the left, the polarity of the electrodes reverses. This leads to a spike in the negative direction.

That’s about it. That’s EOG for you all. I hope you guys enjoyed this post.
Have a great day!

Sources and Extras:
More about EOG
Gif source : The backyard brains
A little more help for focusing-on beginers: In terms of cognitive demand, it is more difficult to focusing on your ongoing task when you have a long to-do list than when only a few more tasks left. So I recommend you to try making schedule with less than 5 tasks a day. It will be much easier to organize work of different fields or of different shades of cognitive demand.
How focusing (aka. not multi-tasking) changed my study life
I had heard it occasionally - that multi-tasking was actually not good for the quality of whatever task I was doing. It made sense, but I loved mult-tasking so much. It gave me the illusion of productivity.
Until I actually tried focusing for a while, did I realise how much I was actually losing by multi-tasking - educationally and emotionally. Scrolling through tumblr during boring parts of a lecture seemed fine, since there were notes and it probably wouldn’t be tested in such depth anyway. Eating, while scrolling through social media, while watching a tv show, while messaging someone on facebook seemed ‘productive’.
It turns out it was the opposite. It may seem fine, and at times it may actually be okay, but what matters is the principle. Dedicating your whole being to one task, focusing on it, produces much better results. It’s a quality over quantity thing. It also helped to calm me down emotionally - I used to always feel rushed, like there was so many things to do but not enough time to do them. Focusing on one task at a time - though it was hard at first - helped slow me down because I did everything properly, and didn’t have the feeling like I needed to go back and do things over again.
Focusing on one thing wholly is also a form of practising mindfulness. Mindfulness ‘meditation’ isn’t something that requires you to sit down and meditate - it can be applied to our daily life.
Since I started practising this mindful skill of focus, I’ve become much calmer, it’s been so much easier to stay on top of my work load and meet deadlines, I don’t feel rushed, I don’t feel unprepared or unorganised, and I do more quality work than when I used to multi-task.
There are times for multi-tasking and times for focus. Find the right balance and enjoy the task in front of you.
White jellyfish by Alberto Montalesi Via Flickr:
Largest Batch of Earth-size, Habitable Zone Planets
Our Spitzer Space Telescope has revealed the first known system of seven Earth-size planets around a single star. Three of these planets are firmly located in an area called the habitable zone, where liquid water is most likely to exist on a rocky planet.
This exoplanet system is called TRAPPIST-1, named for The Transiting Planets and Planetesimals Small Telescope (TRAPPIST) in Chile. In May 2016, researchers using TRAPPIST announced they had discovered three planets in the system.

Assisted by several ground-based telescopes, Spitzer confirmed the existence of two of these planets and discovered five additional ones, increasing the number of known planets in the system to seven.
This is the FIRST time three terrestrial planets have been found in the habitable zone of a star, and this is the FIRST time we have been able to measure both the masses and the radius for habitable zone Earth-sized planets.
All of these seven planets could have liquid water, key to life as we know it, under the right atmospheric conditions, but the chances are highest with the three in the habitable zone.

At about 40 light-years (235 trillion miles) from Earth, the system of planets is relatively close to us, in the constellation Aquarius. Because they are located outside of our solar system, these planets are scientifically known as exoplanets. To clarify, exoplanets are planets outside our solar system that orbit a sun-like star.

In this animation, you can see the planets orbiting the star, with the green area representing the famous habitable zone, defined as the range of distance to the star for which an Earth-like planet is the most likely to harbor abundant liquid water on its surface. Planets e, f and g fall in the habitable zone of the star.
Using Spitzer data, the team precisely measured the sizes of the seven planets and developed first estimates of the masses of six of them. The mass of the seventh and farthest exoplanet has not yet been estimated.

For comparison…if our sun was the size of a basketball, the TRAPPIST-1 star would be the size of a golf ball.
Based on their densities, all of the TRAPPIST-1 planets are likely to be rocky. Further observations will not only help determine whether they are rich in water, but also possibly reveal whether any could have liquid water on their surfaces.
The sun at the center of this system is classified as an ultra-cool dwarf and is so cool that liquid water could survive on planets orbiting very close to it, closer than is possible on planets in our solar system. All seven of the TRAPPIST-1 planetary orbits are closer to their host star than Mercury is to our sun.

The planets also are very close to each other. How close? Well, if a person was standing on one of the planet’s surface, they could gaze up and potentially see geological features or clouds of neighboring worlds, which would sometimes appear larger than the moon in Earth’s sky.

The planets may also be tidally-locked to their star, which means the same side of the planet is always facing the star, therefore each side is either perpetual day or night. This could mean they have weather patterns totally unlike those on Earth, such as strong wind blowing from the day side to the night side, and extreme temperature changes.

Because most TRAPPIST-1 planets are likely to be rocky, and they are very close to one another, scientists view the Galilean moons of Jupiter – lo, Europa, Callisto, Ganymede – as good comparisons in our solar system. All of these moons are also tidally locked to Jupiter. The TRAPPIST-1 star is only slightly wider than Jupiter, yet much warmer.
How Did the Spitzer Space Telescope Detect this System?
Spitzer, an infrared telescope that trails Earth as it orbits the sun, was well-suited for studying TRAPPIST-1 because the star glows brightest in infrared light, whose wavelengths are longer than the eye can see. Spitzer is uniquely positioned in its orbit to observe enough crossing (aka transits) of the planets in front of the host star to reveal the complex architecture of the system.

Every time a planet passes by, or transits, a star, it blocks out some light. Spitzer measured the dips in light and based on how big the dip, you can determine the size of the planet. The timing of the transits tells you how long it takes for the planet to orbit the star.

The TRAPPIST-1 system provides one of the best opportunities in the next decade to study the atmospheres around Earth-size planets. Spitzer, Hubble and Kepler will help astronomers plan for follow-up studies using our upcoming James Webb Space Telescope, launching in 2018. With much greater sensitivity, Webb will be able to detect the chemical fingerprints of water, methane, oxygen, ozone and other components of a planet’s atmosphere.
At 40 light-years away, humans won’t be visiting this system in person anytime soon…that said…this poster can help us imagine what it would be like:

Make sure to follow us on Tumblr for your regular dose of space: http://nasa.tumblr.com
If it is just us, seems like an awful waste of space.
Carl Sagan (from Contact)

sich wie die Axt im Wald benehmen
to behave like the axe in the forest
to behave like a bull in the china shop
(via thatswhywelovegermany)


WORKING ON CHRISTMAS: While the beautiful Earth looms in the background, astronaut Steven Smith stands on the mobile foot restraint at the end of the remote manipulator system as he makes repairs to the Hubble Space Telescope, Dec. 24-25, 1999. (NASA)