Your gateway to endless inspiration
NOAA - Blog Posts
Comin’ in Hot: Seven Things to Know About our New Heat Shield
What goes up, must come down, and from space, without burning up in an atmosphere. That’s why we’re pumped for the Low-Earth Orbit Flight Test of an Inflatable Decelerator, or LOFTID. Launching on Nov. 1, 2022, with the National Oceanic and Atmospheric Administration’s (NOAA) Joint Polar Orbiting Satellite System-2 (JPSS-2) mission, this technology demonstration marks the next step in advancing an innovative heat shield design that could one day be used to land heavy payloads – including humans – on Mars!

Here are seven things to know about this innovative re-entry system:
1. LOFTID is the first-ever in-orbit test of this technology.
Inflatable heat shields, called Hypersonic Inflatable Aerodynamic Decelerators (HIADs), have been in the works for more than a decade. In 2012, the third of the Inflatable Re-entry Vehicle Experiments (IRVE) launched on a suborbital sounding rocket from the Wallops Flight Facility, demonstrating a 3-meter (10-foot) diameter inflatable heat shield.

But the LOFTID re-entry vehicle, at 19.7 feet (6 meters) in diameter, will be the largest blunt body aeroshell to ever go through atmospheric entry. Designed to withstand temperatures as high as 2900°F (1600°C), this first-ever in-orbit test of this technology will prove if it can successfully slow down large payloads – such as crewed spacecraft, robotic explorers, and rocket components – enabling them to survive the heat of re-entry at planetary destinations with an atmosphere.
2. You can find out how this tech works in real-time.
LOFTID is unique in that all operations will happen within a few hours of launch. After the JPSS-2 satellite safely reaches orbit, the LOFTID vehicle will separate from the upper stage of the Atlas V rocket and begin re-entry into Earth’s atmosphere. If all goes as planned, the technology will help the vehicle decelerate from hypersonic (more than 25 times faster than the speed of sound) down to subsonic flight, less than 609 miles per hour for a safe splash down and recovery from the Pacific Ocean.
While in flight, engineers at NASA’s Langley Research Center will receive location data every 20 seconds and onboard sensors and cameras will record more comprehensive data about the technology’s performance. You can get a behind-the-scenes look at Langley’s Flight Mission Support Center where the LOFTID project team will be monitoring the flight test at NASA.gov/live following the launch.

3. A lemon-sized capsule ejected into the Pacific Ocean will hold key flight data.
The LOFTID re-entry vehicle will record both sensor and camera data during its flight. The data will include the temperatures and pressures experienced by the heat shield and will illustrate how well the technology performed during the demonstration.
Although the goal is to retrieve the LOFTID re-entry vehicle after it splashes down in the Pacific Ocean, the team wanted a back-up option just in case they can’t recover it. Enter the tiny yellow package called an ejectable data module (EDM) which will also record flight data. The EDM will be released from the spacecraft at an altitude of about 50,000 feet. It will free fall into the Pacific Ocean off the coast of Hawaii and should land within 10 miles of the spacecraft’s splash down location. A recovery team, that has practiced hide-and-seek of the EDM on land and sea, will use GPS to search an approximately 900-mile area of the Pacific Ocean to find their “lemon.”

4. This heat shield packs a punch.
Although NASA has historically relied on rigid aeroshells, parachutes, and retro-propulsion (rockets) to decelerate people, vehicles, and hardware during entry, descent, and landing operations, a benefit of inflatable heat shields is that they take up less space in a rocket, allowing more room for other hardware or payloads. LOFTID’s aeroshell has been folded and tightly packed down to 4 by 1.5 feet for launch and stacked in the United Launch Alliance (ULA) Atlas V rocket payload fairing.

5. LOFTID is dedicated in honor of one of its innovators.
LOFTID was developed as a partnership with ULA and is dedicated to the memory of Bernard Kutter, ULA manager of advanced programs, who passed away in August 2020. Kutter was instrumental in advancing the inflatable heat shield design and developing the plan to test the system on an Atlas V rocket. He was an advocate for both space technology and expanding access to space. Kutter’s NASA and ULA counterparts agree that LOFTID is unlikely to have made it to space without his vision and passion.
6. LOFTID is made of tough stuff.
Synthetic fibers make up the inflatable structure, braided into tubes that are, by weight, 10 times stronger than steel. The tubes are coiled so that they form the shape of a blunt cone when inflated. The thermal protection system that covers the inflatable structure can survive searing entry temperatures up to 2,900 degrees Fahrenheit. Researchers used the same heat-shielding materials to create a fire shelter prototype for firefighters battling forest fires.
7. You can make your own LOFTID Halloween costume!
Still looking for an out-of-this world Halloween costume? With a few commonly found materials, like orange pool noodles and duct tape, you can create your own LOFTID costume. However, we make no promises of protecting or slowing you down from becoming the life of the party.

Follow @NASA_Technology for the latest updates on LOFTID. Don’t miss our live coverage leading up to launch from the Vandenberg Space Force Base in California. The NASA Edge JPSS-2 Tower Rollback Show airs live on NASA TV and YouTube on Tuesday, Nov. 1 at 12 a.m. EDT, and NASA TV live launch coverage will begin at 4:45 a.m. EDT.
Make sure to follow us on Tumblr for your regular dose of space!
How Climate Change Showed Up in 2021
2021 was tied for the sixth-hottest year since modern record keeping began. We work together with the National Oceanic and Atmospheric Administration to track temperatures around the world and study how they change from year to year.

For decades, the overall global temperature has been increasing because of human activities. The last decade has been the warmest on record. Each individual year’s average temperature, however, can be affected by things like ocean circulation, volcanic eruptions, and specific weather events.
For instance, last year we saw the beginning of La Niña – a pattern of cooler waters in the Pacific – that was responsible for slightly cooling 2021’s average temperature. Still, last year continued a long-term trend of global warming.
Globally, Earth’s temperature in 2021 was nearly 2°F warmer than the late 19th Century, for the seventh year in a row.

The Record
Studying 142 Years
Since 1880, we can put together a consistent record of temperatures around the planet and see that it was much colder in the late-19th century. Before 1880, uncertainties in tracking global temperatures are larger. Temperatures have increased even faster since the 1970s, the result of increasing greenhouse gases in the atmosphere.
Tracking Millions of Individual Observations
Our scientists use millions of individual observations of data from more than 20,000 weather stations and Antarctic research stations, together with ship- and buoy-based observations of sea surface temperatures, to track global temperatures.

Reviewing Multiple Independent Records
Our global temperature record – GISTEMP – is one of a number of independent global temperature records, all of which show the same pattern of warming.

The Consequences
Everywhere Experiences Climate Change Differently
As Earth warms, temperature changes occur unevenly around the globe. The Arctic is currently warming about four times faster than the rest of the planet – a process called Arctic amplification. Similarly, urban areas tend to warm faster than rural areas, partly because building materials like asphalt, steel and concrete retain heat.

Droughts and Floods in Warmer Weather
More than 88% of the Western US experienced drought conditions in 2021. At the same time, communities in Western Europe saw two months’ worth of rain in 24 hours, breaking records and triggering flash floods. Because a hotter climate means more water can be carried in the atmosphere, areas like the Western US suffer drought from the increased 'thirstiness' of the atmosphere, while precipitation events can become more extreme as the amount of moisture in the atmosphere rises.

Sea Levels Continue to Rise
Melting ice raises sea levels around the world, as meltwater drains into the ocean. In addition, heat causes the ocean water to expand. From 1993 to today, global mean sea level has been rising around 3.4 millimeters per year. In 2021, sea level data from the recently launched NASA/ESA Sentinel-6 Michael Freilich mission became available to the public.

There is Hope
“This is not good news, but the fact that we are able to track this in real time and understand why it’s changing, and get people to notice why it’s changing and how we can change things to change the next trajectory, that gives me hope. Because we’re not in the dark here. We’re not the dinosaurs who are unaware the comet is coming. We can see the comet coming, and we can act.” – Dr. Gavin Schmidt, director of NASA GISS, where the global temperature record is calculated
Make sure to follow us on Tumblr for your regular dose of space!
One Hot Year after Another
Globally, 2020 was the hottest year on record, effectively tying 2016, the previous record. Overall, Earth’s average temperature has risen more than 2 degrees Fahrenheit since the 1880s.

Temperatures are increasing due to human activities, specifically emissions of greenhouse gases, like carbon dioxide and methane.
Heat and the energy it carries are what drive our planet: winds, weather, droughts, floods, and more are expressions of heat. The right amount of heat is even one of the things that makes life on Earth possible. But too much heat is changing the way our planet’s systems act.
My World’s on Fire
Higher temperatures drive longer, more intense fire seasons. As rain and snowfall patterns change, some regions are getting drier and more vulnerable to damage, setting the stage for more fires.

2020 saw several record-breaking fires, both in Australia in the beginning of the year, and in the western U.S. through northern summer and fall. Smoke from fires in both regions reached so high into the atmosphere that it formed clouds and continues to travel around the globe today.

In the Siberian Arctic, unusually high temperatures helped drive at least 19 fires in the region. More than half of them were burning peat soil -- decomposed organic materials -- that stores a lot of carbon. Peat fires release vast amounts of carbon into the atmosphere, potentially leading to even more warming.

The Water’s Getting Warm
It wasn’t just fire seasons setting records. 2020 had more named tropical storms in the Atlantic and more storms making landfall in the U.S. than any hurricane season on record.

Hurricanes rely on warm ocean water as fuel, and this year, the Atlantic provided. 30 named storms weren’t the only things that made this year’s hurricane season notable.

Storms like Eta, Delta, and Iota quickly changed from smaller, weaker tropical storms into more destructive hurricanes. This rapid intensification is complicated, but it’s likely that warmer, more humid weather -- a result of climate change -- helps drive it.

The Ice Is Getting Thin
Add enough heat, and even the biggest chunk of ice will melt. That’s true whether we’re talking about the ice cubes in your glass or the vast sheets of ice at our planet’s poles. Right now, the Arctic region is warming about three times faster than the rest of our planet, which has some major effects both locally and globally.

This year, Arctic sea ice hit a near-record low. Sea ice is actually made of frozen ocean water, and it grows and thaws with the seasons, typically reaching an annual minimum extent in September.

Warmer ocean water led to more ice melting this year, and 2020’s annual minimum extent continued a long trend of shrinking Arctic sea ice extent.
A Long Trend
We study Earth and how it’s changing from the ground, the sky, and space. Using data from sensors all around the planet, we calculate the global average temperature, working with our partners at NOAA.
Many other organizations also track global temperature using their own instruments and methods, and they all match remarkably well. The last seven years were the hottest seven years on record. Earth is getting warmer.

We also study the effects of increasing temperatures, like the melting sea ice and longer fire seasons mentioned above. Additionally, we can study the cause of climate change from space, with a bird’s eye view of increasing carbon in the atmosphere.

The planet is changing because of human activities. We’re working together with other agencies to monitor changes and understand what this means for people in the future.
Make sure to follow us on Tumblr for your regular dose of space: http://nasa.tumblr.com.
Tracking the Sun’s Cycles
Scientists just announced that our Sun is in a new cycle.
Solar activity has been relatively low over the past few years, and now that scientists have confirmed solar minimum was in December 2019, a new solar cycle is underway — meaning that we expect to see solar activity start to ramp up over the next several years.

The Sun goes through natural cycles, in which the star swings from relatively calm to stormy. At its most active — called solar maximum — the Sun is freckled with sunspots, and its magnetic poles reverse. At solar maximum, the Sun’s magnetic field, which drives solar activity, is taut and tangled. During solar minimum, sunspots are few and far between, and the Sun’s magnetic field is ordered and relaxed.

Understanding the Sun’s behavior is an important part of life in our solar system. The Sun's violent outbursts can disturb the satellites and communications signals traveling around Earth, or one day, Artemis astronauts exploring distant worlds. Scientists study the solar cycle so we can better predict solar activity.

Measuring the solar cycle
Surveying sunspots is the most basic of ways we study how solar activity rises and falls over time, and it’s the basis of many efforts to track the solar cycle. Around the world, observers conduct daily sunspot censuses. They draw the Sun at the same time each day, using the same tools for consistency. Together, their observations make up the international sunspot number, a complex task run by the World Data Center for the Sunspot Index and Long-term Solar Observations, at the Royal Observatory of Belgium in Brussels, which tracks sunspots and pinpoints the highs and lows of the solar cycle. Some 80 stations around the world contribute their data.

Credit: USET data/image, Royal Observatory of Belgium, Brussels
Other indicators besides sunspots can signal when the Sun is reaching its low. In previous cycles, scientists have noticed the strength of the Sun’s magnetic field near the poles at solar minimum hints at the intensity of the next maximum. When the poles are weak, the next peak is weak, and vice versa.
Another signal comes from outside the solar system. Cosmic rays are high-energy particle fragments, the rubble from exploded stars in distant galaxies that shoot into our solar system with astounding energy. During solar maximum, the Sun’s strong magnetic field envelops our solar system in a magnetic cocoon that is difficult for cosmic rays to infiltrate. In off-peak years, the number of cosmic rays in the solar system climbs as more and more make it past the quiet Sun. By tracking cosmic rays both in space and on the ground, scientists have yet another measure of the Sun’s cycle.

Since 1989, an international panel of experts—sponsored by NASA and NOAA—meets each decade to make their prediction for the next solar cycle. The prediction includes the sunspot number, a measure of how strong a cycle will be, and the cycle’s expected start and peak. This new solar cycle is forecast to be about the same strength as the solar cycle that just ended — both fairly weak. The new solar cycle is expected to peak in July 2025.
Learn more about the Sun’s cycle and how it affects our solar system at nasa.gov/sunearth.
Make sure to follow us on Tumblr for your regular dose of space: http://nasa.tumblr.com.
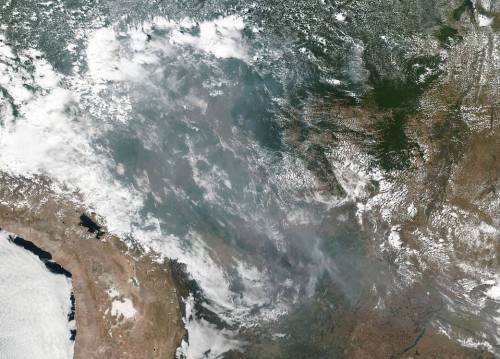
Fires in the Amazon Rainforest
This natural-color image shows smoke from fires in the Amazon rainforest spreading across several states within Brazil, including Amazonas, Mato Grosso, and Rondônia. The image was collected by our VIIRS (Visible Infrared Imaging Radiometer Suite) instrument aboard the Suomi NPP satellite (a joint-partnership between NASA and the National Oceanic and Atmospheric Administration) on August 20, 2019. It’s not unusual to see fires in Brazil at this time of year, but activity in the country’s largest state, Amazonas, has been above average. Many people use fire to maintain farmland and pastures or to clear land for other purposes.
Credits: NASA Worldview, Earth Observing System Data and Information System (EOSDIS).
Make sure to follow us on Tumblr for your regular dose of space: http://nasa.tumblr.com.
Earth’s Ocean and Beyond

Image Credit: NOAA
Earth’s ocean has been the backdrop for ancient epics, tales of fictional fish and numerous scientific discoveries. It was, and will always be, a significant piece of the Earth's story. Most of the ocean is unexplored– about 95% of this underwater realm is unseen by human eyes (NOAA). There is only one global Ocean. In fact, the ocean represents over 70% of the Earth's surface and contains 96.5% of the Earth’s water.
We and the NOAA Office of Ocean Exploration and Research work together alongside organizations like the Schmidt Ocean Institute and Ocean Exploration Trust to better understand our oceans and its processes. While space may be the final frontier, understanding our own planet helps scientists as they explore space and study how our universe came to be.
On #WorldOceansDay let’s explore how Earth’s ocean informs our research throughout the solar system.
Earth and Exoplanets

“In interpreting what we see elsewhere in the solar system and universe, we always compare with phenomena that we already know of on Earth...We work from the familiar toward the unknown.” - Norman Kuring, NASA Goddard
We know of only one living planet: our own. As we move to the next stage in the search for alien life, the effort will require the expertise of scientists of all disciplines. However, the knowledge and tools NASA has developed to study life on Earth will also be one of the greatest assets to the quest.
The photo above shows what Earth would look like at a resolution of 3 pixels, the same that exoplanet-discovering missions would see. What should we look for, in the search of other planets like our own? What are the unmistakable signs of life, even if it comes in a form we don't fully understand? Liquid water; every cell we know of -- even bacteria around deep-sea vents that exist without sunlight -- requires water.
Phytoplankton (Algae) Bloom vs. Atmosphere of Jupiter

Jupiter’s storms are mesmerizing in their beauty, captured in many gorgeous photos throughout the decades from missions like Voyager 1 and Juno. The ethereal swirls of Jupiter are the result of fluids in motion on a rotating body, which might come as a surprise, since its atmosphere is made of gas!
The eddies in Jupiter’s clouds appear very similar to those found in Earth’s ocean, like in the phytoplankton (or algae) bloom in the Baltic Sea, pictured above. The bloom was swept up in a vortex, just a part of how the ocean moves heat, carbon, and nutrients around the planet. Blooms like this, however, are not all beauty - they create “dead zones” in the areas where they grow, blooming and decaying at such a high rate that they consume all the oxygen in the water around them.
Arctic Sea Ice and Europa Ice Crust

While the Arctic (North Pole) and the Antarctic (South Pole) are “polar opposites,” there is one huge difference between the North and South Poles– land mass. The Arctic is ocean surrounded by land, while the Antarctic is land surrounded by ocean. The North Pole is located in the middle of the Arctic Ocean amid waters that are almost permanently covered with constantly shifting sea ice.
By studying this sea ice, scientists can research its impact on Earth system and even formation processes on other bodies like Europa, an icy moon of Jupiter. For example, it is possible that the reddish surface features on Europa’s ice may have communicated with a global subsurface ocean layer during or after their formation.
Aquanauts and Astronauts

As new missions are being developed, scientists are using Earth as a testbed. Just as prototypes for our Mars rovers made their trial runs on Earth's deserts, researchers are testing both hypotheses and technology on our oceans and extreme environments.
NEEMO, our Extreme Environment Mission Operations project, is an analog mission that sends groups of astronauts, engineers and scientists to live in Aquarius, the world's only undersea research station located off the Florida Keys, 62 feet (19 meters) below the surface. Much like space, the undersea world is a hostile, alien place for humans to live. NEEMO crew members, known as aquanauts, experience some of the same challenges there that they would on a distant asteroid, planet or moon.
Deep-sea Robotic Exploration and Space Robotic Exploration

Video credit: Deep Sea Robotics/Schmidt Ocean Institute and Mars Curiosity rover/NASA
From mapping the seafloor through bathymetry to collecting samples on the surface of Mars, researchers are utilizing new technologies more than ever to explore. Satellite and robotic technology allow us to explore where humans may not be able to– yet. They teach us valuable lessons about the extreme and changing environments, science, as well as provide a platform to test new technologies.
Jezero Crater and Dvina River Delta, Arkhangelsk, Russia/Mars Delta

River deltas, the point where a river meets the ocean, are sites of rich sediment and incredible biodiversity. The nutrients that rivers carry to the coastlines make a fertile place for fish and shellfish to lay their eggs.
The Jezero crater on Mars (pictured in false-color on the right) has been selected as the Mars2020 landing site, and has a structure that looks much like a river delta here on Earth! Pictures from our Mars Global Surveyor orbiter show eroded ancient deposits of transported sediment long since hardened into interweaving, curved ridges of layered rock. This is one of many hints that Mars was once covered in an ancient ocean that had more water than the Arctic Ocean. Studying these deltas on Earth helps us spot them on other planets, and learning about the ocean that was once on Mars informs how our own formed.
Make sure to follow us on Tumblr for your regular dose of space: http://nasa.tumblr.com.
Hurricanes Have No Place to Hide, Thanks to Better Satellite Forecasts

If you’ve ever looked at a hurricane forecast, you’re probably familiar with “cones of uncertainty,” the funnel-shaped maps showing a hurricane’s predicted path. Thirty years ago, a hurricane forecast five days before it made landfall might have a cone of uncertainty covering most of the East Coast. The result? A great deal of uncertainty about who should evacuate, where it was safe to go, and where to station emergency responders and their equipment.

Over the years, hurricane forecasters have succeeded in shrinking the cone of uncertainty for hurricane tracks, with the help of data from satellites. Polar-orbiting satellites, which fly nearly directly above the North and South Poles, are especially important in helping cut down on forecast error.

The orbiting electronic eyeballs key to these improvements: the Joint Polar Satellite System (JPSS) fleet. A collaborative effort between NOAA and NASA, the satellites circle Earth, taking crucial measurements that inform the global, regional and specialized forecast models that have been so critical to hurricane track forecasts.

The forecast successes keep rolling in. From Hurricanes Harvey, Irma and Maria in 2017 through Hurricanes Florence and Michael in 2018, improved forecasts helped manage coastlines, which translated into countless lives and property saved. In September 2018, with the help of this data, forecasters knew a week ahead of time where and when Hurricane Florence would hit. Early warnings were precise enough that emergency planners could order evacuations in time — with minimal road clogging. The evacuations that did not have to take place, where residents remained safe from the hurricane’s fury, were equally valuable.

The satellite benefits come even after the storms make landfall. Using satellite data, scientists and forecasters monitor flooding and even power outages. Satellite imagery helped track power outages in Puerto Rico after Hurricane Maria and in the Key West area after Hurricane Irma, which gave relief workers information about where the power grid was restored – and which regions still lacked electricity.

Flood maps showed the huge extent of flooding from Hurricane Harvey and were used for weeks after the storm to monitor changes and speed up recovery decisions and the deployment of aid and relief teams.

As the 2019 Atlantic hurricane season kicks off, the JPSS satellites, NOAA-20 and Suomi-NPP, are ready to track hurricanes and tropical cyclones as they form, intensify and travel across the ocean – our eyes in the sky for severe storms.
For more about JPSS, follow @JPSSProgram on Twitter and facebook.com/JPSS.Program, or @NOAASatellites on Twitter and facebook.com/NOAASatellites.
Make sure to follow us on Tumblr for your regular dose of space: http://nasa.tumblr.com.
Keeping an Eye on Hurricane Florence
What do hurricanes look like from space? It depends on how you look! We have satellites, cameras and instruments all working together to give us the big picture of storms like Florence.
As the International Space Station passed over Hurricane Florence, astronauts and cameras on board got a look down into the hurricane’s eye.
Our Global Precipitation Measurement (GPM) mission sees storms all around the planet by measuring rainfall. These measurements come from a constellation of satellites working together, including some from our partner organizations like the National Oceanic and Atmospheric Administration (NOAA) and the Japanese Aerospace Exploration Agency (JAXA).

On Sept. 7, our GPM core observatory satellite flew over Florence, capturing a 3D image as the storm’s clouds started to break apart before reforming.

Other NOAA satellites, like GOES, gather high-resolution, detailed views of hurricanes, letting us peek into the eye of the storm.

Zooming out a bit, the Suomi-NPP satellite helps us track Hurricane Florence, and the following tropical storms, as they move closer to landfall or dissipate over the ocean.

From farther away (a million miles from Earth!), the EPIC instrument on NOAA’s DSCOVR satellite captured images of all three of these storms as they moved closer to North America.

We use our space-based and airborne instruments to provide innovative data on hurricanes to advance scientists’ understanding of these storms. You can follow our latest views of Hurricane Florence here and get the latest forecast from NOAA’s National Hurricane Center here.
What Scientists Are Learning from the Eclipse
While millions of people in North America headed outside to watch the eclipse on Aug. 21, 2017, hundreds of scientists got out telescopes, set up instruments, and prepared balloon launches – all so they could study the Sun and its complicated influence on Earth.

Total solar eclipses happen about once every 18 months somewhere in the world, but the August eclipse was rare because of its long path over land. The total eclipse lasted more than 90 minutes over land, from when it first reached Oregon to when it left the U.S. in South Carolina.

This meant that scientists could collect more data from land than during most eclipses, giving us new insight into our world and the star that powers it.
A moment in the Sun’s atmosphere
During a total solar eclipse, the Sun’s outer atmosphere, the corona, is visible from Earth. It’s normally too dim to see next to the Sun’s bright face, but, during an eclipse, the Moon blocks out the Sun, revealing the corona.

Image Credit: Peter Aniol, Miloslav Druckmüller and Shadia Habbal
Though we can study parts of the corona with instruments that create artificial eclipses, some of the innermost regions of the corona are only visible during total solar eclipses. Solar scientists think this part of the corona may hold the secrets to some of our most fundamental questions about the Sun: Like how the solar wind – the constant flow of magnetized material that streams out from the Sun and fills the solar system – is accelerated, and why the corona is so much hotter than the Sun’s surface below.
Depending on where you were, someone watching the total solar eclipse on Aug. 21 might have been able to see the Moon completely obscuring the Sun for up to two minutes and 42 seconds. One scientist wanted to stretch that even further – so he used a pair of our WB-57 jets to chase the path of the Moon’s shadow, giving their telescopes an uninterrupted view of the solar corona for just over seven and half minutes.

These telescopes were originally designed to help monitor space shuttle launches, and the eclipse campaign was their first airborne astronomy project!

These scientists weren’t the only ones who had the idea to stretch out their view of the eclipse: The Citizen CATE project (short for Continental-America Telescopic Eclipse) did something similar, but with the help of hundreds of citizen scientists.
Citizen CATE included 68 identical small telescopes spread out across the path of totality, operated by citizen and student scientists. As the Moon’s shadow left one telescope, it reached the next one in the lineup, giving scientists a longer look at the way the corona changes throughout the eclipse.

After accounting for clouds, Citizen CATE telescopes were able to collect 82 minutes of images, out of the 93 total minutes that the eclipse was over the US. Their images will help scientists study the dynamics of the inner corona, including fast solar wind flows near the Sun’s north and south poles.
The magnetized solar wind can interact with Earth’s magnetic field, causing auroras, interfering with satellites, and – in extreme cases – even straining our power systems, and all these measurements will help us better understand how the Sun sends this material speeding out into space.
Exploring the Sun-Earth connection
Scientists also used the eclipse as a natural laboratory to explore the Sun’s complicated influence on Earth.
High in Earth’s upper atmosphere, above the ozone layer, the Sun’s intense radiation creates a layer of electrified particles called the ionosphere. This region of the atmosphere reacts to changes from both Earth below and space above. Such changes in the lower atmosphere or space weather can manifest as disruptions in the ionosphere that can interfere with communication and navigation signals.

One group of scientists used the eclipse to test computer models of the ionosphere’s effects on these communications signals. They predicted that radio signals would travel farther during the eclipse because of a drop in the number of energized particles. Their eclipse day data – collected by scientists spread out across the US and by thousands of amateur radio operators – proved that prediction right.
In another experiment, scientists used the Eclipse Ballooning Project to investigate the eclipse’s effects lower in the atmosphere. The project incorporated weather balloon flights from a dozen locations to form a picture of how Earth’s lower atmosphere – the part we interact with and which directly affects our weather – reacted to the eclipse. They found that the planetary boundary layer, the lowest part of Earth’s atmosphere, actually moved closer to Earth during the eclipse, dropped down nearly to its nighttime altitude.

A handful of these balloons also flew cards containing harmless bacteria to explore the potential for contamination of other planets with Earth-born life. Earth’s stratosphere is similar to the surface of Mars, except in one main way: the amount of sunlight. But during the eclipse, the level of sunlight dropped to something closer to what you’d expect to see on Mars, making this the perfect testbed to explore whether Earth microbes could hitch a ride to the Red Planet and survive. Scientists are working through the data collected, hoping to build up better information to help robotic and human explorers alike avoid carrying bacterial hitchhikers to Mars.

Image: The small metal card used to transport bacteria.
Finally, our EPIC instrument aboard NOAA’s DSCOVR satellite provided awe-inspiring views of the eclipse, but it’s also helping scientists understand Earth’s energy balance. Earth’s energy system is in a constant dance to maintain a balance between incoming radiation from the Sun and outgoing radiation from Earth to space, which scientists call the Earth’s energy budget. The role of clouds, both thick and thin, is important in their effect on energy balance.

Like a giant cloud, the Moon during the total solar eclipse cast a large shadow across a swath of the United States. Scientists know the dimensions and light-blocking properties of the Moon, so they used ground- and space-based instruments to learn how this large shadow affects the amount of sunlight reaching Earth’s surface, especially around the edges of the shadow. Measurements from EPIC show a 10% drop in light reflected from Earth during the eclipse (compared to about 1% on a normal day). That number will help scientists model how clouds radiate the Sun’s energy – which drives our planet’s ocean currents, seasons, weather and climate – away from our planet.
For even more eclipse science updates, stay tuned to nasa.gov/eclipse.
Make sure to follow us on Tumblr for your regular dose of space: http://nasa.tumblr.com.
The Sun Just Released the Most Powerful Flare of this Solar Cycle
The Sun released two significant solar flares on Sept. 6, including one that clocked in as the most powerful flare of the current solar cycle.
The solar cycle is the approximately 11-year-cycle during which the Sun’s activity waxes and wanes. The current solar cycle began in December 2008 and is now decreasing in intensity and heading toward solar minimum, expected in 2019-2020. Solar minimum is a phase when solar eruptions are increasingly rare, but history has shown that they can nonetheless be intense.

Footage of the Sept. 6 X2.2 and X9.3 solar flares captured by the Solar Dynamics Observatory in extreme ultraviolet light (131 angstrom wavelength)
Our Solar Dynamics Observatory satellite, which watches the Sun constantly, captured images of both X-class flares on Sept. 6.
Solar flares are classified according to their strength. X-class denotes the most intense flares, followed by M-class, while the smallest flares are labeled as A-class (near background levels) with two more levels in between. Similar to the Richter scale for earthquakes, each of the five levels of letters represents a 10-fold increase in energy output.
The first flare peaked at 5:10 a.m. EDT, while the second, larger flare, peaked at 8:02 a.m. EDT.

Footage of the Sept. 6 X2.2 and X9.3 solar flares captured by the Solar Dynamics Observatory in extreme ultraviolet light (171 angstrom wavelength) with Earth for scale
Solar flares are powerful bursts of radiation. Harmful radiation from a flare cannot pass through Earth's atmosphere to physically affect humans on the ground, however — when intense enough — they can disturb Earth’s atmosphere in the layer where GPS and communications signals travel.
Both Sept. 6 flares erupted from an active region labeled AR 2673. This area also produced a mid-level solar flare on Sept. 4, 2017. This flare peaked at 4:33 p.m. EDT, and was about a tenth the strength of X-class flares like those measured on Sept. 6.

Footage of the Sept. 4 M5.5 solar flare captured by the Solar Dynamics Observatory in extreme ultraviolet light (131 angstrom wavelength)
This active region continues to produce significant solar flares. There were two flares on the morning of Sept. 7 as well.
For the latest updates and to see how these events may affect Earth, please visit NOAA’s Space Weather Prediction Center at http://spaceweather.gov, the U.S. government’s official source for space weather forecasts, alerts, watches and warnings.
Follow @NASASun on Twitter and NASA Sun Science on Facebook to keep up with all the latest in space weather research.
Make sure to follow us on Tumblr for your regular dose of space: http://nasa.tumblr.com.
GOES-R: The Future of Forecasting

What is GOES-R?
The Geostationary Operational Environmental Satellite-R Series (GOES-R) is the nation’s next generation of geostationary weather satellites. It is the first of four satellites to be launched for the National Oceanic and Atmospheric Administration (NOAA).
The GOES-R satellite will provide advanced imaging with increased spatial resolution and faster coverage for more accurate forecasts, real-time mapping of lightning activity and improved monitoring of solar activity. For the first time, GOES-R will be able to monitor the Earth in near real-time.

Once in geostationary orbit (the orbit around the Earth’s equator), it will provide images of weather patterns and severe storms across the continental U.S. as regularly as every five minutes. Images of smaller, more detailed areas, where storm activity is present, will be taken as frequently as every 30 seconds.
These images can be used to aid in formulating regular forecasts, term forecasting, such as seasonal predictions and drought outlooks.

In addition, the satellite will constantly monitor space weather conditions, such as solar flares, to provide advance notice of potential communication and navigation disruptions.

The satellite will also assist researchers in understanding the interactions between land, oceans, the atmosphere and climate.
What will GOES-R Do?
Improve hurricane tracking and intensity forecasts
Increase thunderstorm and tornado warning lead time
Give earlier warning of ground lightning strike hazards
Improve detection of heavy rainfall and flash flooding risks
Improve air quality warnings and alerts
Give better fire detection and intensity estimation
Improve solar flare warnings for communications and navigation disruptions
Give more accurate monitoring of energetic particles responsible for radiation hazards to humans and spacecraft
Improve monitoring of space weather to get better geomagnetic storm forecasting.
The better we can predict what’s coming, the better we can prepare.
Launch Activities!
The GOES-R satellite is targeted for a launch on Saturday, Nov. 19, aboard a United Launch Alliance Atlas V rocket.

The one-hour launch window opens at 5:42 p.m. EST. Liftoff will occur from our Kennedy Space Center in Florida.
Join us leading up to launch by tuning in during the following times:
Thursday, Nov. 17 Prelaunch News Conference - 1 p.m. EST Watch HERE
GOES-R Mission Briefing - 2 p.m. EST Watch HERE
Friday, Nov. 18 GOES-R Social Presentations – 1:30 p.m. EST Watch HERE
Saturday, Nov. 19 NASA Edge Prelaunch Program – 3:45 p.m. EST Watch HERE
Launch Coverage & Commentary – 4:45 p.m. EST Watch HERE
Make sure to follow us on Tumblr for your regular dose of space: http://nasa.tumblr.com